Octave – 绘制数据的基础
Octave 有一些用于可视化数据的内置函数。很少有简单的图表可以让我们更好地理解我们的数据。每当我们在 Octave 环境中执行学习算法时,我们都可以更好地了解该算法并对其进行分析。 Octave 有很多简单的工具,我们可以使用它们来更好地理解我们的算法。
在本教程中,我们将学习如何在 Octave 环境中绘制数据以获得更好的可视化和理解它。
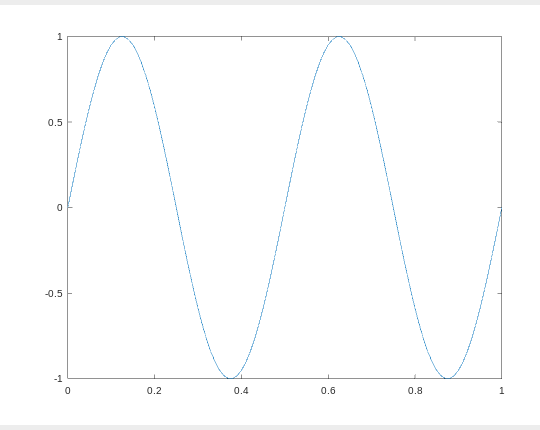
示例 1:使用 plot() 和 sin()函数绘制正弦波:
MATLAB
% var_x for the y-axis
var_x = [0:0.01:1];

% var_y for the y-axis
var_y = sin(4 * pi * var);

% plotting the graph
plot(var_x, var_y);
MATLAB
% var_x for the y-axis
var_x = [0:0.01:1];

% var_y for the y-axis
var_y = cos(3 * pi * var);

% plotting the graph
plot(var_x, var_y);
MATLAB
% declaring variable var_x
var_x = [0:0.01:1];

% declaring variable var_y1
var_y1 = sin(4 * pi * var);

% declaring variable var_y2
var_y2 = cos(3 * pi * var);

% plot var_x with var_y1
plot(var_x, var_y1);

% hold the above plot or figure
hold on;

% plot var with var_y2 with red color
plot(var_x, var_y2, 'r');
MATLAB
% declaring variable var_x
var_x = [0:0.01:1];

% declaring variable var_y1
var_y1 = sin(4 * pi * var);


% declaring variable var_y2
var_y2 = cos(3 * pi * var);

% plot var_x with var_y1
plot(var_x, var_y1);

% hold the above plot or figure
hold on;

% plot var with var_y2 with red color
plot(var_x, var_y2, 'r');

% adding label to the x-axis
xlabel('time');

% adding label to the y-axis
ylabel('value');

% adding title for the plot
title('my first plot');

% add legends for these 2 curves
legend('sin', 'cos');
MATLAB
% declaring variable var_x
var_x = [0:0.01:1];

% declaring variable var_y1
var_y1 = sin(4 * pi * var);

% declaring variable var_y2
var_y2 = cos(3 * pi * var);

% plot var_x and var_y1 on figure 1
figure(1);
plot(var_x,var_y);

% plot var_x and var_y2 on figure 2
figure(2);
plot(var_x,var_y2);
MATLAB
% var_x for the y-axis
var_x = [0:0.01:1];

% var_y for the y-axis
var_y = sin(4 * pi * var);

% plot the var_x and var_y on a 3x3 grid
% at 4 position counting from top to left
subplot(3, 3, 4), plot(var_x, var_y);
MATLAB
% declaring variable var_x
var_x = [0:0.01:1];

% declaring variable var_y1
var_y1 = sin(4 * pi * var);

% declaring variable var_y2
var_y2 = cos(3 * pi * var);

% plot var_x with var_y1
plot(var_x, var_y1);

% hold the above plot or figure
hold on;

% plot var with var_y2 with red color
plot(var_x, var_y2, 'r');

% adding label to the x-axis
xlabel('time');

% adding label to the y-axis
ylabel('value');

% adding title for the plot
title('my first plot');

% add legends for these 2 curves
legend('sin', 'cos');

% first 2 parameter sets the x-axis
% and next 2 will set the y-axis
axis([0.5 1 -1 1])
MATLAB
print -dpng 'plot.png'MATLAB
cd '/home/dikshant/Documents'; print -dpng 'plot.png'MATLAB
% creating a 10x10 magic matrix
matrix = magic(10)

% plot the matrix
imagesc(matrix)
MATLAB
% creating a 10x10 magic matrix
matrix = magic(10)

% plot this matrix with showing colorbar on the right of it
imagesc(matrix), colorbar;
MATLAB
% creating a 10x10 magic matrix
matrix = magic(10)

% plot this matrix with colorbar and gray colormap
imagesc(matrix), colorbar, colormap gray;
输出 :
示例 2:使用 plot() 和 cos()函数绘制余弦波:
MATLAB
% var_x for the y-axis
var_x = [0:0.01:1];

% var_y for the y-axis
var_y = cos(3 * pi * var);

% plotting the graph
plot(var_x, var_y);
输出 :

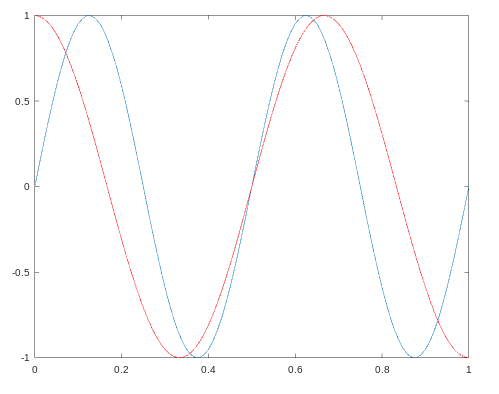
示例 3:我们可以通过使用 hold on 命令保持前一个绘图来绘制一个绘图覆盖另一个绘图。
MATLAB
% declaring variable var_x
var_x = [0:0.01:1];

% declaring variable var_y1
var_y1 = sin(4 * pi * var);

% declaring variable var_y2
var_y2 = cos(3 * pi * var);

% plot var_x with var_y1
plot(var_x, var_y1);

% hold the above plot or figure
hold on;

% plot var with var_y2 with red color
plot(var_x, var_y2, 'r');
输出 :
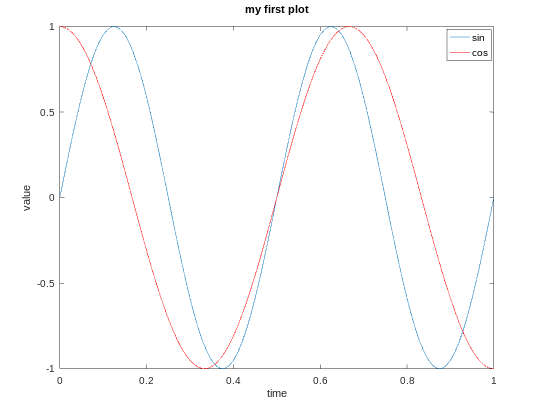
示例 4:我们可以使用以下代码为 x 轴和 y 轴添加标签以及图例和标题。
MATLAB
% declaring variable var_x
var_x = [0:0.01:1];

% declaring variable var_y1
var_y1 = sin(4 * pi * var);


% declaring variable var_y2
var_y2 = cos(3 * pi * var);

% plot var_x with var_y1
plot(var_x, var_y1);

% hold the above plot or figure
hold on;

% plot var with var_y2 with red color
plot(var_x, var_y2, 'r');

% adding label to the x-axis
xlabel('time');

% adding label to the y-axis
ylabel('value');

% adding title for the plot
title('my first plot');

% add legends for these 2 curves
legend('sin', 'cos');
输出 :
示例 5:我们还可以在不同的图形上绘制数据。
MATLAB
% declaring variable var_x
var_x = [0:0.01:1];

% declaring variable var_y1
var_y1 = sin(4 * pi * var);

% declaring variable var_y2
var_y2 = cos(3 * pi * var);

% plot var_x and var_y1 on figure 1
figure(1);
plot(var_x,var_y);

% plot var_x and var_y2 on figure 2
figure(2);
plot(var_x,var_y2);
输出 :

示例 6:我们可以使用 subplot()函数将图形划分为 amxn 网格。在下面的代码中,前 2 个参数显示 m 和 n,第三个参数是从上到左的网格数。
MATLAB
% var_x for the y-axis
var_x = [0:0.01:1];

% var_y for the y-axis
var_y = sin(4 * pi * var);

% plot the var_x and var_y on a 3x3 grid
% at 4 position counting from top to left
subplot(3, 3, 4), plot(var_x, var_y);
输出 :

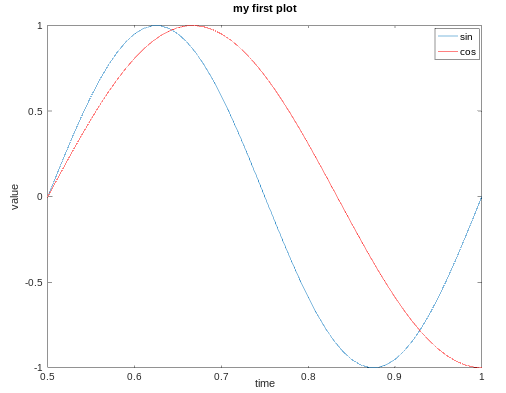
示例 7:我们可以使用 axis()函数更改任何绘图的轴值。
MATLAB
% declaring variable var_x
var_x = [0:0.01:1];

% declaring variable var_y1
var_y1 = sin(4 * pi * var);

% declaring variable var_y2
var_y2 = cos(3 * pi * var);

% plot var_x with var_y1
plot(var_x, var_y1);

% hold the above plot or figure
hold on;

% plot var with var_y2 with red color
plot(var_x, var_y2, 'r');

% adding label to the x-axis
xlabel('time');

% adding label to the y-axis
ylabel('value');

% adding title for the plot
title('my first plot');

% add legends for these 2 curves
legend('sin', 'cos');

% first 2 parameter sets the x-axis
% and next 2 will set the y-axis
axis([0.5 1 -1 1])
这里前 2 个参数显示 x 轴的范围,接下来的 2 个参数显示 y 轴的范围。
输出 :
示例 8:我们可以将绘图保存在当前工作目录中:
MATLAB
print -dpng 'plot.png'
为了在我们想要的位置打印这个图,我们可以使用 cd 如下所示:
MATLAB
cd '/home/dikshant/Documents'; print -dpng 'plot.png'
我们可以使用 close 命令关闭图形/绘图。
示例 9:我们可以使用 imagesc()函数可视化矩阵。
MATLAB
% creating a 10x10 magic matrix
matrix = magic(10)

% plot the matrix
imagesc(matrix)
输出 :
matrix =

    92    99     1     8    15    67    74    51    58    40
    98    80     7    14    16    73    55    57    64    41
     4    81    88    20    22    54    56    63    70    47
    85    87    19    21     3    60    62    69    71    28
    86    93    25     2     9    61    68    75    52    34
    17    24    76    83    90    42    49    26    33    65
    23     5    82    89    91    48    30    32    39    66
    79     6    13    95    97    29    31    38    45    72
    10    12    94    96    78    35    37    44    46    53
    11    18   100    77    84    36    43    50    27    59
上图是 10×10 的网格,每个网格代表一个带有颜色的值。相同的颜色值会产生相同的颜色。
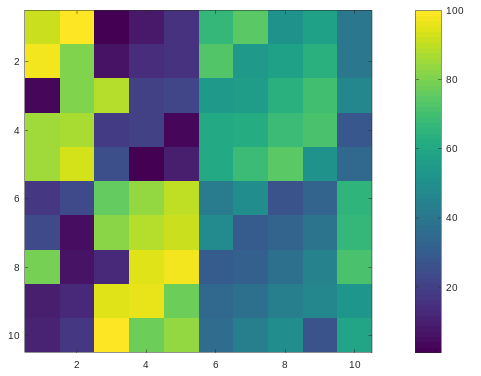
我们还可以使用该图制作一个颜色条,以使用 colorbar 命令查看哪个值对应于哪种颜色。在 Octave 环境中,我们可以通过用逗号 ( , ) 分隔它们来一次使用多个命令。
MATLAB
% creating a 10x10 magic matrix
matrix = magic(10)

% plot this matrix with showing colorbar on the right of it
imagesc(matrix), colorbar;
输出 :
使用灰度颜色图绘制幻方:
MATLAB
% creating a 10x10 magic matrix
matrix = magic(10)

% plot this matrix with colorbar and gray colormap
imagesc(matrix), colorbar, colormap gray;
输出 :
