使用Python在Python中创建和更新 PowerPoint 演示文稿 – pptx
python-pptx是用于创建/编辑PowerPoint (.pptx) 文件的库。这不适用于 MS Office 2003 和以前的版本。我们可以使用这个库添加形状、段落、文本和幻灯片等等。
安装:在系统上打开命令提示符并编写以下命令:
pip install python-pptx
让我们看看它的一些用法:
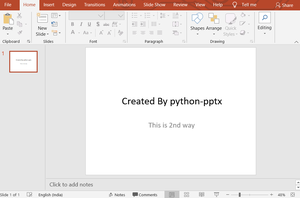
示例 1:创建带有标题和副标题幻灯片的新 PowerPoint 文件。
Python3
# import Presentation class
# from pptx library
from pptx import Presentation

# Creating presentation object
root = Presentation()

# Creating slide layout
first_slide_layout = root.slide_layouts[0]

""" Ref for slide types:
0 ->  title and subtitle
1 ->  title and content
2 ->  section header
3 ->  two content
4 ->  Comparison
5 ->  Title only
6 ->  Blank
7 ->  Content with caption
8 ->  Pic with caption
"""

# Creating slide object to add
# in ppt i.e. Attaching slides
# with Presentation i.e. ppt
slide = root.slides.add_slide(first_slide_layout)

# Adding title and subtitle in
# slide i.e. first page of slide
slide.shapes.title.text = " Created By python-pptx"

# We have different formats of
# subtitles in ppts, for simple
# subtitle this method should
# implemented, you can change
# 0 to 1 for different design
slide.placeholders[1].text = " This is 2nd way"

# Saving file
root.save("Output.pptx")

print("done")
Python3
# import required things
from pptx import Presentation
from pptx.util import Inches, Pt

# Creating Object
ppt = Presentation()

# To create blank slide layout
# We have to use 6 as an argument
# of slide_layouts
blank_slide_layout = ppt.slide_layouts[6]

# Attaching slide obj to slide
slide = ppt.slides.add_slide(blank_slide_layout)

# For adjusting the  Margins in inches
left = top = width = height = Inches(1)

# creating textBox
txBox = slide.shapes.add_textbox(left, top,
                                 width, height)

# creating textFrames
tf = txBox.text_frame
tf.text = "This is text inside a textbox"

# adding Paragraphs
p = tf.add_paragraph()

# adding text
p.text = "This is a second paragraph that's bold and italic"

# font
p.font.bold = True
p.font.italic = True

p = tf.add_paragraph()
p.text = "This is a third paragraph that's big "
p.font.size = Pt(40)

# save file
ppt.save('test_2.pptx')

print("done")
Python3
# import Presentation class
# from pptx library
from pptx import Presentation

# creating an object
ppt = Presentation("sample.pptx")

# open file in write mode
File_to_write_data = open("File_To_Extract_ppt.txt", "w")

# write text from powerpoint
# file into .txt file
for slide in ppt.slides:
    for shape in slide.shapes:
        if not shape.has_text_frame:
            continue
        for paragraph in shape.text_frame.paragraphs:
            for run in paragraph.runs:
                File_to_write_data.write(run.text)

# close the file
File_to_write_data.close()

print("Done")
Python3
from pptx import Presentation
from pptx.util import Inches

# Giving Image path
img_path = 'bg_bg.png'

# Creating an Presentation object
ppt = Presentation()

# Selecting blank slide
blank_slide_layout = ppt.slide_layouts[6]

# Attaching slide to ppt
slide = ppt.slides.add_slide(blank_slide_layout)

# For margins
left = top = Inches(1)

# adding images
pic = slide.shapes.add_picture(img_path,
                               left, top)

left = Inches(1)
height = Inches(1)

pic = slide.shapes.add_picture(img_path, left,
                               top, height = height)
# save file
ppt.save('test_4.pptx')

print("Done")
Python3
# import required classes/functions/method
from pptx import Presentation
from pptx.chart.data import CategoryChartData
from pptx.enum.chart import XL_CHART_TYPE
from pptx.util import Inches


# Create presentation object
ppt = Presentation()

# Adding slide with specific layout
slide = ppt.slides.add_slide(ppt.slide_layouts[6])

# Define chart data
# Creating object of chart
chart_data = CategoryChartData()

# Adding categories to chart
chart_data.categories = ['East', 'West', 'Midwest']

# Adding series
chart_data.add_series('Series 1',
                      (int(input("Enter Value:")),
                        int(input("Enter Value:")),
                        int(input("Enter Value:"))))

x, y, cx, cy = Inches(2), Inches(2), Inches(6), Inches(4.5)

slide.shapes.add_chart( XL_CHART_TYPE.COLUMN_CLUSTERED, x,
                       y, cx, cy, chart_data )

# Saving file
ppt.save('chart-Tutorial.pptx')

print("done")
Python3
# importing
from pptx import Presentation
from pptx.util import Inches

# create a Presentation object
ppt = Presentation()

# Adding a blank slide in out ppt
slide = ppt.slides.add_slide(ppt.slide_layouts[6])

# Adjusting the width !
x, y, cx, cy = Inches(2), Inches(2), Inches(4), Inches(1.5)

# Adding tables
shape = slide.shapes.add_table(3, 4, x,
                               y, cx, cy)

# Saving the file
ppt.save("Tabel_Tutorial.pptx")

print("done")
输出:
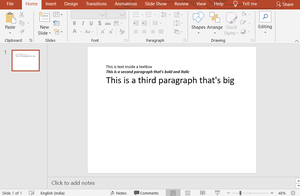
示例 2:在 PowerPoint 中添加文本框。
Python3
# import required things
from pptx import Presentation
from pptx.util import Inches, Pt

# Creating Object
ppt = Presentation()

# To create blank slide layout
# We have to use 6 as an argument
# of slide_layouts
blank_slide_layout = ppt.slide_layouts[6]

# Attaching slide obj to slide
slide = ppt.slides.add_slide(blank_slide_layout)

# For adjusting the  Margins in inches
left = top = width = height = Inches(1)

# creating textBox
txBox = slide.shapes.add_textbox(left, top,
                                 width, height)

# creating textFrames
tf = txBox.text_frame
tf.text = "This is text inside a textbox"

# adding Paragraphs
p = tf.add_paragraph()

# adding text
p.text = "This is a second paragraph that's bold and italic"

# font
p.font.bold = True
p.font.italic = True

p = tf.add_paragraph()
p.text = "This is a third paragraph that's big "
p.font.size = Pt(40)

# save file
ppt.save('test_2.pptx')

print("done")
输出:
示例 3: PowerPoint (.pptx) 文件到文本 (.txt) 文件的转换。
Python3
# import Presentation class
# from pptx library
from pptx import Presentation

# creating an object
ppt = Presentation("sample.pptx")

# open file in write mode
File_to_write_data = open("File_To_Extract_ppt.txt", "w")

# write text from powerpoint
# file into .txt file
for slide in ppt.slides:
    for shape in slide.shapes:
        if not shape.has_text_frame:
            continue
        for paragraph in shape.text_frame.paragraphs:
            for run in paragraph.runs:
                File_to_write_data.write(run.text)

# close the file
File_to_write_data.close()

print("Done")
输出:

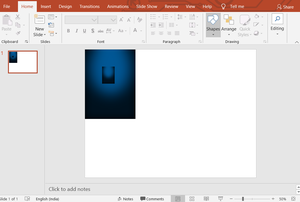
示例 4:将图像插入 PowerPoint 文件。
Python3
from pptx import Presentation
from pptx.util import Inches

# Giving Image path
img_path = 'bg_bg.png'

# Creating an Presentation object
ppt = Presentation()

# Selecting blank slide
blank_slide_layout = ppt.slide_layouts[6]

# Attaching slide to ppt
slide = ppt.slides.add_slide(blank_slide_layout)

# For margins
left = top = Inches(1)

# adding images
pic = slide.shapes.add_picture(img_path,
                               left, top)

left = Inches(1)
height = Inches(1)

pic = slide.shapes.add_picture(img_path, left,
                               top, height = height)
# save file
ppt.save('test_4.pptx')

print("Done")
输出:
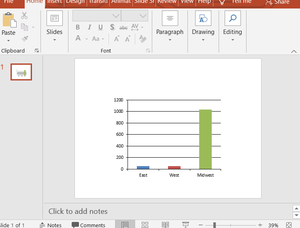
示例 5:将图表添加到 PowerPoint 文件。
Python3
# import required classes/functions/method
from pptx import Presentation
from pptx.chart.data import CategoryChartData
from pptx.enum.chart import XL_CHART_TYPE
from pptx.util import Inches


# Create presentation object
ppt = Presentation()

# Adding slide with specific layout
slide = ppt.slides.add_slide(ppt.slide_layouts[6])

# Define chart data
# Creating object of chart
chart_data = CategoryChartData()

# Adding categories to chart
chart_data.categories = ['East', 'West', 'Midwest']

# Adding series
chart_data.add_series('Series 1',
                      (int(input("Enter Value:")),
                        int(input("Enter Value:")),
                        int(input("Enter Value:"))))

x, y, cx, cy = Inches(2), Inches(2), Inches(6), Inches(4.5)

slide.shapes.add_chart( XL_CHART_TYPE.COLUMN_CLUSTERED, x,
                       y, cx, cy, chart_data )

# Saving file
ppt.save('chart-Tutorial.pptx')

print("done")
输出:
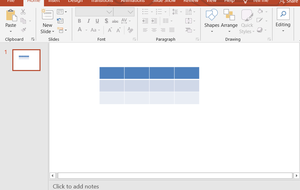
示例 6:将表格添加到 PowerPoint 文件中。
Python3
# importing
from pptx import Presentation
from pptx.util import Inches

# create a Presentation object
ppt = Presentation()

# Adding a blank slide in out ppt
slide = ppt.slides.add_slide(ppt.slide_layouts[6])

# Adjusting the width !
x, y, cx, cy = Inches(2), Inches(2), Inches(4), Inches(1.5)

# Adding tables
shape = slide.shapes.add_table(3, 4, x,
                               y, cx, cy)

# Saving the file
ppt.save("Tabel_Tutorial.pptx")

print("done")
输出: