R 编程中的可变性
变异性(也称为统计离散)是描述性统计的另一个特征。集中趋势和变异性的测量共同包括描述性统计。可变性显示了数据集围绕一个点的分布。
示例:假设存在 2 个均值相同的数据集:
A = 4, 4, 5, 6, 6
Mean(A) = 5
B = 1, 1, 5, 9, 9
Mean(B) = 5
因此,为了区分这两个数据集,R 提供了各种可变性度量。
可变性度量
以下是 R 提供的用于区分数据集的一些可变性度量:
- 方差
- 标准差
- 范围
- 平均偏差
- 四分位距
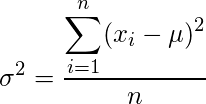
方差
方差是一种度量,显示每个值与特定点的距离,最好是平均值。在数学上,它被定义为与平均值的平方差的平均值。
公式:

在哪里,
![]() specifies variance of the data set
specifies variance of the data set![]() specifies
specifies ![]() value in data set
value in data set![]() specifies the mean of data set
specifies the mean of data set
n specifies total number of observations
在 R 语言中,有一个标准的内置函数来计算数据集的方差。
Syntax: var(x)
Parameter:
x: It is data vector
例子:
# Defining vector
x <- c(5, 5, 8, 12, 15, 16)

# Print variance of x
print(var(x))
输出:
[1] 23.76667
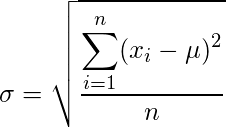
标准差
统计中的标准偏差衡量数据值相对于平均值的分布,在数学上,计算为方差的平方根。
公式: 
在哪里,
![]() specifies standard deviation of the data set
specifies standard deviation of the data set![]() specifies
specifies ![]() value in data set
value in data set![]() specifies the mean of data set
specifies the mean of data set
n specifies total number of observations
在 R 语言中,没有标准的内置函数来计算数据集的标准差。因此,修改代码以找到数据集的标准差。
例子:
# Defining vector
x <- c(5, 5, 8, 12, 15, 16)

# Standard deviation
d <- sqrt(var(x))

# Print standard deviation of x
print(d)
输出:
[1] 4.875107
范围
范围是数据集的最大值和最小值之间的差异。在 R 语言中, max()和min()用于求相同,而不像range()函数返回数据集的最小值和最大值。
例子:
# Defining vector
x <- c(5, 5, 8, 12, 15, 16)

# range() function output
print(range(x))

# Using max() and min() function
# to calculate the range of data set
print(max(x)-min(x))
输出:
[1]  5 16
[1] 11
平均偏差
平均偏差是通过取每个值与中心值的绝对差的算术平均值来计算的度量。中心值可以是平均值、中位数或众数。
公式: 
在哪里,
![]() specifies
specifies ![]() value in data set
value in data set![]() specifies the mean of data set
specifies the mean of data set
n specifies total number of observations
在 R 语言中,没有标准的内置函数来计算平均偏差。因此,修改代码以找到数据集的平均偏差。
例子:
# Defining vector
x <- c(5, 5, 8, 12, 15, 16)

# Mean deviation
md <- sum(abs(x-mean(x)))/length(x)

# Print mean deviation
print(md)
输出:
[1] 4.166667
四分位距
四分位数范围基于将数据集拆分为称为四分位数的部分。有 3 个四分位数(Q1、Q2、Q3)将整个数据集分成 4 个相等的部分。 Q2 指定整个数据集的中位数。
在数学上,四分位距表示为:
IQR = Q3 – Q1
在哪里,
Q3 specifies the median of n largest values
Q1 specifies the median of n smallest values
在 R 语言中,内置了计算数据集四分位距的函数。
Syntax: IQR(x)
Parameter:
x: It specifies the data set
例子:
# Defining vector
x <- c(5, 5, 8, 12, 15, 16)

# Print Interquartile range
print(IQR(x))
输出:
[1] 8.5