在 MATLAB 中绘制表达式或函数
在本文中,我们将讨论如何在 MATLAB 中绘制表达式或函数。我们可以使用MATLAB 中的fplot()函数来生成与表达式或函数对应的图。
fplot()函数有不同的变体
- fplot(f)
- fplot(f,xinterval)
- fplot(___,LineSpec)
- fplot(___,名称,值)
现在详细讨论每个变体。以下是在 MATLAB 中绘制表达式或函数的各种方法:
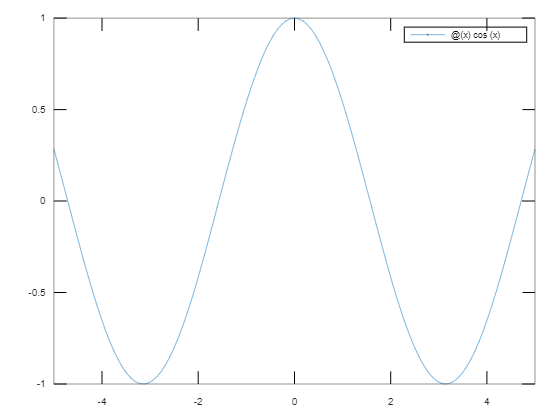
fplot(f):绘制作为参数传递给它的表达式。
示例:在默认区间 [-5 5] 中绘制cos(x)函数
Matlab
% Plots cos(x) function from x=-5 to 5
fplot(@(x) cos(x))
Matlab
% Plots the sin(x) cureve from x =[-3:3]
fplot(@(x) sin(x),[-3 3])
Matlab
% plotting exp(x) function in the interval [-5 8]
% with a red solid line with star marker.
fplot(@(x) exp(x),[-5 8],'-*r')
Matlab
% Plot the sin(2x) function with a
% linewidth of 2, and blue dotted
% line with circle marker
fplot(@(x) sin(2*x),[-5 8],'Color','b','Marker','o',
'LineWidth',2,'LineStyle','--')
Matlab
% Plotting sin(x)
fplot(@(x) sin(x))
hold on

% Resuming the plot and
% including cos(2*x)
fplot(@(x) cos(2*x))
hold off
输出 :
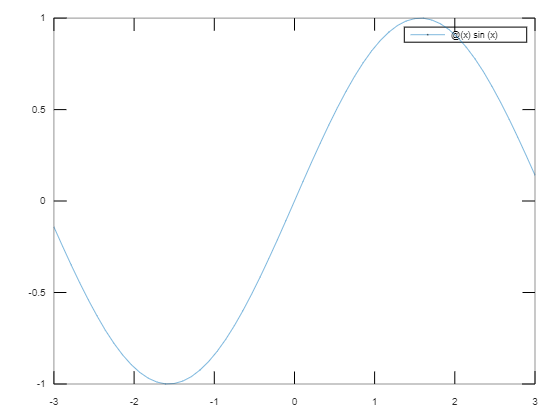
fplot(f,xinterval):在指定的区间内绘制由函数y = f(x) 定义的曲线。将区间指定为[xmin xmax]形式的二元素向量。
示例:在区间 [-3 3] 中绘制cos(x)函数。
MATLAB
% Plots the sin(x) cureve from x =[-3:3]
fplot(@(x) sin(x),[-3 3])
输出 :
fplot(___,LineSpec)
- 它允许指定线条属性,例如线条样式、标记符号和颜色。
- 例如, 'b'绘制一条蓝线。我们可以在指定函数和区间后指定这些属性。
- 线型、标记和颜色,指定为包含任意顺序符号的字符向量或字符串。例如: '-*r'表示带有 Asterisk 的红色实线。您还可以省略某些属性。
每个属性的一些值是Linestyle Meaning Marker Meaning Color Meaning ‘-‘ Solid ‘o’ Circle ‘r’ Red ‘:’ Dotted ‘+’ Plus sign ‘q’ Green ‘–‘ Dashed ‘*’ Asterik ‘b’ Blue
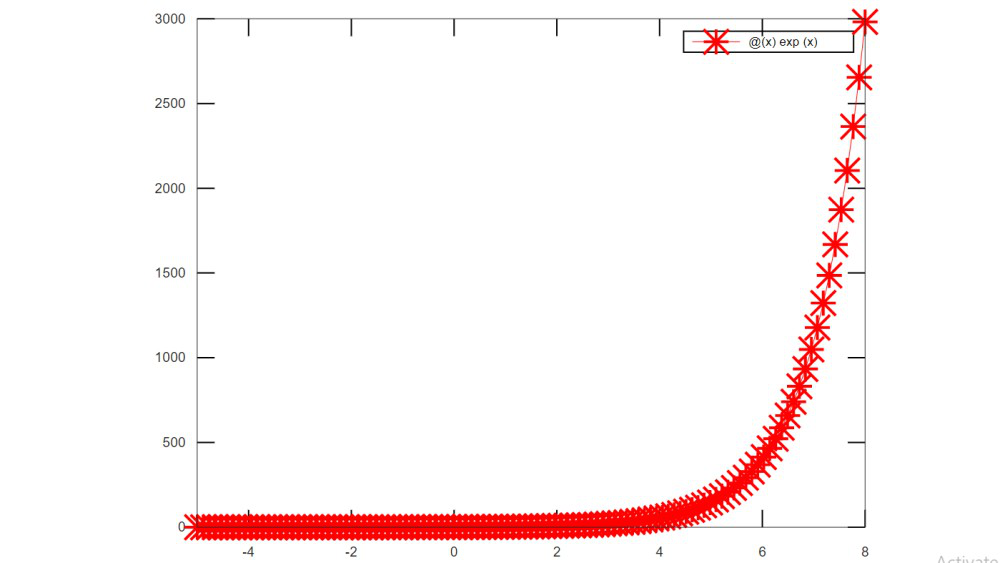
示例:在区间 [-5 8] 中绘制带有星标的红色实线的exp(x)函数。
MATLAB
% plotting exp(x) function in the interval [-5 8]
% with a red solid line with star marker.
fplot(@(x) exp(x),[-5 8],'-*r')
输出 :
fplot(___,名称,值)
- 使用名称-值对参数指定行属性的另一种方法。
- 例如'颜色','r'表示红线。
- 我们还可以指定LineWidth、Marker、Color、LineStyle等属性。
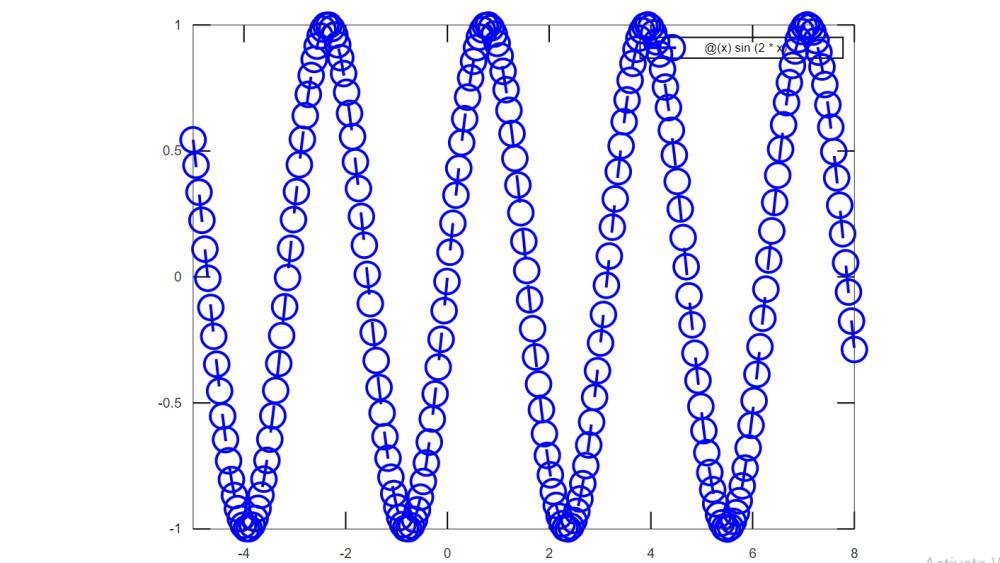
示例:通过指定名称和值对,绘制线宽为 2 的sin(2x)函数和带有圆形标记的蓝色虚线。
MATLAB
% Plot the sin(2x) function with a
% linewidth of 2, and blue dotted
% line with circle marker
fplot(@(x) sin(2*x),[-5 8],'Color','b','Marker','o',
'LineWidth',2,'LineStyle','--')
输出 :
我们可以在一个图中描绘多个表达式。下面是我们在同一图中绘制sin(x)和cos(2*x)的示例:
MATLAB
% Plotting sin(x)
fplot(@(x) sin(x))
hold on

% Resuming the plot and
% including cos(2*x)
fplot(@(x) cos(2*x))
hold off
输出 :
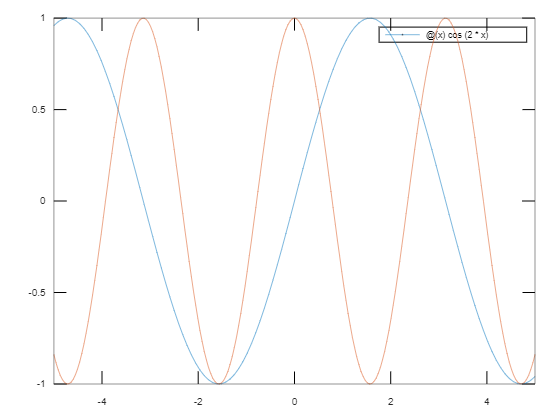
在上面的程序中,我们在同一个图中描绘了两个表达式。在 MATLAB 中使用hold关键字来保持和延迟绘图中的表达式。