使用 Matplotlib 自定义图例
在本文中,您将学习在 matplotlib 中自定义图例。 matplotlib 是一个流行的数据可视化库。它是Python中的一个绘图库,具有数字扩展 NumPy。
图例是描述图表每个部分的图表区域。图表可以很简单。但是添加标题、X 标签、Y 标签和图例会更清晰。通过查看名称,我们可以很容易地猜出图表所代表的内容以及它所代表的数据类型。
让我们先看看如何在 matplotlib 中创建图例。
syntax: legend(*args, **kwargs)
这可以如下调用,
legend() -> automatically detects which element to show. It does this by displaying all plots that have been labeled with the label keyword argument.
legend(labels) -> Name of X and name of Y that is displayed on the legend
legend(handles, labels) -> A list of lines that should be added to the legend. Using handles and labels together can give full control of what should be displayed in the legend. The length of the legend and handles should be the same.
Python3
# importing library
import matplotlib.pyplot as plt
# plotting values
a = [1, 2, 3, 4]
b = [1, 4, 9, 16]
# PLotting using matplotlib
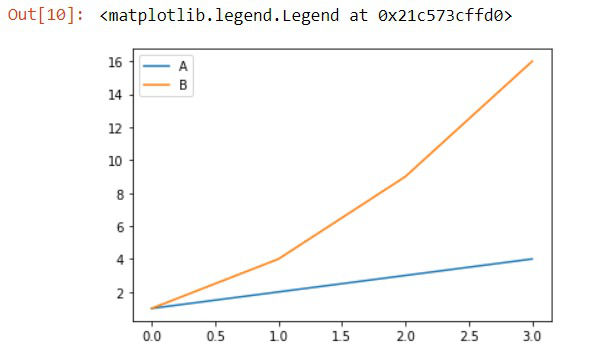
plt.plot(a, label="A")
plt.plot(b, label="B")
# Creating legend
plt.legend()Python3
# importing library
import matplotlib.pyplot as plt

# plotting values
a = [1, 2, 3, 4]
b = [1, 4, 9, 16]

# PLotting using matplotlib
plt.plot(a, label="A")
plt.plot(b, label="B")

# Creating legend
# Adding the location
plt.legend(loc='center left')
Python3
# importing library
import matplotlib.pyplot as plt

# plotting values
a = [1, 2, 3, 4]
b = [1, 4, 9, 16]

# PLotting using matplotlib
plt.plot(a, label="label1")
plt.plot(b, label="label2")

# Creating legend
plt.legend(fontsize='xx-large')
Python3
# importing library
import matplotlib.pyplot as plt

# plotting values
a = [1, 2, 3, 4]
b = [1, 4, 9, 16]

# PLotting using matplotlib
plt.plot(a, label="label1")
plt.plot(b, label="label2")

# Creating legend
# Adding color to the legend
plt.legend(labelcolor='white', facecolor='black',
           edgecolor='red', fontsize='xx-large')
Python3
# importing library
import matplotlib.pyplot as plt

# plotting values
a = [1, 2, 3, 4]
b = [1, 4, 9, 16]

# PLotting using matplotlib
plt.plot(a, label="label1")
plt.plot(b, label="label2")

# Creating legend
plt.legend(markerfirst=False)
Python3
# importing library
import matplotlib.pyplot as plt

# plotting values
a = [1, 2, 3, 4]
b = [1, 4, 9, 16]

# PLotting using matplotlib
plt.plot(a, label="label1")
plt.plot(b, label="label2")

# Creating legend
# Adding shadow and fancybox to the legend
plt.legend(shadow=True, fancybox=True)
Python3
#importing library
import matplotlib.pyplot as plt

#plotting values
a = [1,2,3,4]
b = [1,4,9,16]

#PLotting using matplotlib
plt.plot(a, label="label1")
plt.plot(b, label="label2")

#Creating legend
#removing frame
plt.legend(frameon = False)
Python3
# importing library
import matplotlib.pyplot as plt

# plotting values
a = [1, 2, 3, 4]
b = [1, 4, 9, 16]

# PLotting using matplotlib
plt.plot(a, label="label1")
plt.plot(b, label="label2")

# Creating legend
# giving title and fontsize
plt.legend(title="Legend", title_fontsize='xx-large')
输出:
传奇
自定义图例
图例为图表添加了意义。添加字体、位置等,使图例更加清晰易读。现在,让我们看一些示例程序来自定义绘图的图例。
地点
有时图例可能出现在适当的位置,也可能不在适当的位置。在matplotlib中,我们也可以添加我们想要放置的位置。有了这种灵活性,我们可以将图例放置在不覆盖绘图的地方,因此绘图看起来会更加干净整洁。
Syntax: legend(loc=”)
可以按如下方式传递,
‘upper left’, ‘upper right’, ‘lower left’, ‘lower right’ -> It is placed on the corresponding corner of the plot.
‘upper center’, ‘lower center’, ‘center left’, ‘center right’ -> It is placed on the center of corresponding edge.
‘center’ -> It is placed exact center of the plot.
‘best’ -> It is placed without the overlapping of the artists
例如,
Python3
# importing library
import matplotlib.pyplot as plt

# plotting values
a = [1, 2, 3, 4]
b = [1, 4, 9, 16]

# PLotting using matplotlib
plt.plot(a, label="A")
plt.plot(b, label="B")

# Creating legend
# Adding the location
plt.legend(loc='center left')
输出:
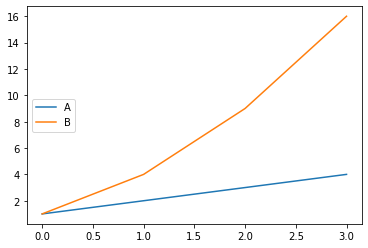
左中
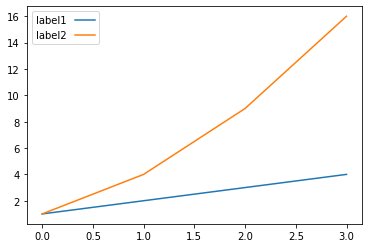
字体大小
为了使图例更具吸引力,我们还可以更改图例的字体大小,通过将参数字体大小传递给函数,我们可以像绘图标题一样更改图例框内的字体大小。
Syntax: legend(fontsize=”)
It can be passed as, ‘xx-small’, ‘x-small’, ‘small’, ‘medium’, ‘large’, ‘x-large’, ‘xx-large’
例子:
Python3
# importing library
import matplotlib.pyplot as plt

# plotting values
a = [1, 2, 3, 4]
b = [1, 4, 9, 16]

# PLotting using matplotlib
plt.plot(a, label="label1")
plt.plot(b, label="label2")

# Creating legend
plt.legend(fontsize='xx-large')
输出:
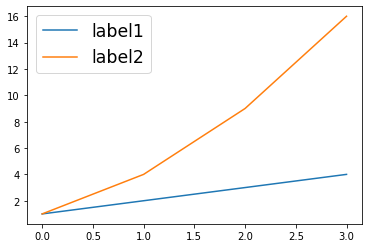
更改字体大小
传说的颜色
有时我们会觉得,如果在图例框里填上一些颜色,让它更有吸引力,让图例从情节中脱颖而出,那就太好了。 Matplotlib 还通过让我们通过更改图例的背景、文本甚至边缘颜色来更改图例的主题来涵盖这一点。-+
Syntax:
legend(labelcolor=”)
labelcolor is used to change the color of the text.
legend(facecolor=”)
facecolor is used to change background color of the legend.
legend(edgecolor=”)
edgecolor is used to change the edge color of the legend
例子:
Python3
# importing library
import matplotlib.pyplot as plt

# plotting values
a = [1, 2, 3, 4]
b = [1, 4, 9, 16]

# PLotting using matplotlib
plt.plot(a, label="label1")
plt.plot(b, label="label2")

# Creating legend
# Adding color to the legend
plt.legend(labelcolor='white', facecolor='black',
           edgecolor='red', fontsize='xx-large')
输出:
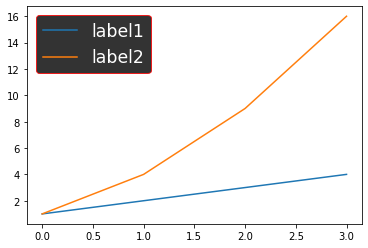
改变图例的颜色。
在上面的示例中,您可以清楚地看到哪些关键字参数为图例赋予颜色。
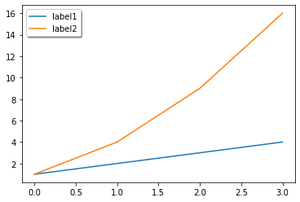
标记属性
如果您看到图例框,
Syntax:
legend(markerfirst = bool, default: True)
默认情况下,首先放置标记,然后放置标签。标记第一个参数用于改变标记的位置。通过将其设为 False,标记和标签位置将被交换。
例子:
Python3
# importing library
import matplotlib.pyplot as plt

# plotting values
a = [1, 2, 3, 4]
b = [1, 4, 9, 16]

# PLotting using matplotlib
plt.plot(a, label="label1")
plt.plot(b, label="label2")

# Creating legend
plt.legend(markerfirst=False)
输出:
标记优先 = 假
改变外观
我们可以使图例具有一些基本的 CSS 属性,例如添加阴影、添加框架和圆角,如果您不想在图中覆盖这些小细节,我们还可以为图例框添加透明度由一个框架。
shadow -> This argument gives shadow behind the legend.
frameon -> Gives the frame to legend.
fancybox -> Gives round edges to the legend.
framealpha -> Gives transparency to legend background.
添加阴影和圆角:
Python3
# importing library
import matplotlib.pyplot as plt

# plotting values
a = [1, 2, 3, 4]
b = [1, 4, 9, 16]

# PLotting using matplotlib
plt.plot(a, label="label1")
plt.plot(b, label="label2")

# Creating legend
# Adding shadow and fancybox to the legend
plt.legend(shadow=True, fancybox=True)
输出:
影子和花式盒子
删除图例框的框架:
Python3
#importing library
import matplotlib.pyplot as plt

#plotting values
a = [1,2,3,4]
b = [1,4,9,16]

#PLotting using matplotlib
plt.plot(a, label="label1")
plt.plot(b, label="label2")

#Creating legend
#removing frame
plt.legend(frameon = False)
输出:
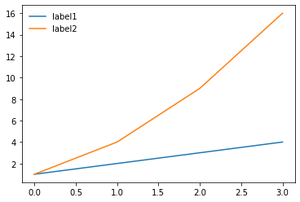
移除框架
图例的标题
为图例添加标题将是添加到图例框中的一个重要方面。 title 参数将让我们为图例指定一个标题,而 title_size 让我们为标题指定一个特定的字体大小。
Syntax:
legend(title=”” , title_fontsize=”)
- 标题为图例提供标题
- title_fontize赋予标题大小。
它可以是,'xx-small','x-small','small','medium','large','x-large','xx-large'
例子:
Python3
# importing library
import matplotlib.pyplot as plt

# plotting values
a = [1, 2, 3, 4]
b = [1, 4, 9, 16]

# PLotting using matplotlib
plt.plot(a, label="label1")
plt.plot(b, label="label2")

# Creating legend
# giving title and fontsize
plt.legend(title="Legend", title_fontsize='xx-large')
输出:
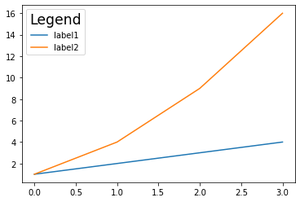
图例的标题