如何在Python中创建残差图
残差图是一个图表,其中残差显示在 y 轴上,自变量显示在 x 轴上。如果残差图中的点随机分布在水平轴上,则线性回归模型适用于数据。让我们看看如何在Python中创建残差图。
方法 1:使用 plot_regress_exog()
plot_regress_exog():
- 将回归结果与一个回归量进行比较。
- “endog vs exog”、“residuals vs exog”、“fitted vs exog”和“fitted plus residual vs exog”以2×2的图形绘制。
Syntax: statsmodels.graphics.regressionplots.plot_regress_exog(results, exog_idx, fig=None)
Parameters:
- results: result instance
- exog_idx: index or name of the regressor
- fig : a figure is created if no figure is provided
Returns: 2X2 figure
单线性回归
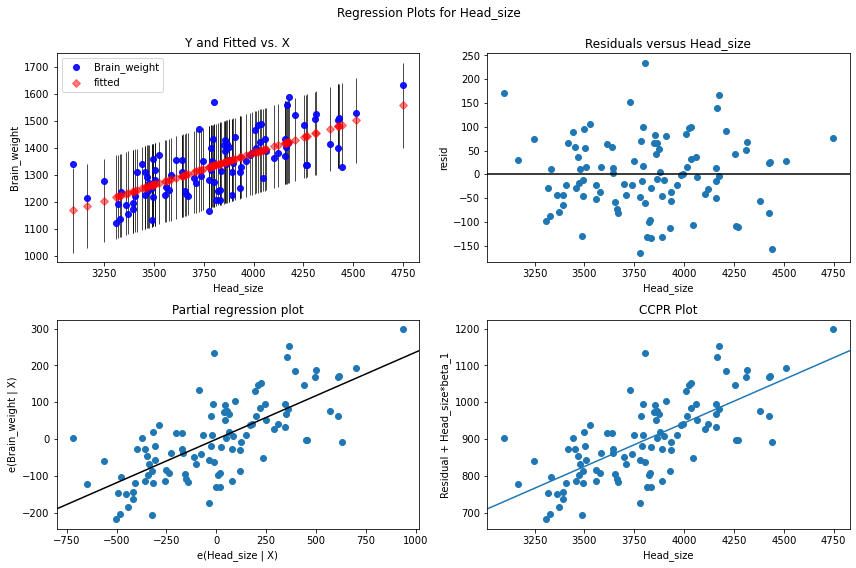
导入必要的包并读取 CSV 文件后,我们使用 statsmodels.formula.api 中的 ols() 将数据拟合到线性回归。我们创建一个图形并将该图形、自变量的名称和回归模型传递给 plot_regress_exog() 方法。显示 2X2 残差图。在 ols() 方法中,“~”之前的字符串是因变量或我们试图预测的变量,“~”之后是自变量。对于线性回归,有一个因变量和一个自变量。
ols(‘response_variable ~ predictor_variable’, data= data)
使用的CSV: headbrain3
Python3
# import packages and libraries
import numpy as np
import pandas as pd
import matplotlib.pyplot as plt
import statsmodels.api as sm
from statsmodels.formula.api import ols

# reading the csv file
data = pd.read_csv('headbrain3.csv')

# fit simple linear regression model
linear_model = ols('Brain_weight ~ Head_size',
                   data=data).fit()

# display model summary
print(linear_model.summary())

# modify figure size
fig = plt.figure(figsize=(14, 8))

# creating regression plots
fig = sm.graphics.plot_regress_exog(linear_model,
                                    'Head_size',
                                    fig=fig)
Python3
# import packages and libraries
import numpy as np
import pandas as pd
import matplotlib.pyplot as plt
import statsmodels.api as sm
from statsmodels.formula.api import ols

# reading the csv file
data = pd.read_csv('homeprices.csv')
data

# fit multi linear regression model
multi_model = ols('price ~ area + bedrooms', data=data).fit()

# display model summary
print(multi_model.summary())

# modify figure size
fig = plt.figure(figsize=(14, 8))

# creating regression plots
fig = sm.graphics.plot_regress_exog(multi_model, 'area', fig=fig)
Python3
# import packages and libraries
import numpy as np
import pandas as pd
import matplotlib.pyplot as plt
import statsmodels.api as sm
from statsmodels.formula.api import ols

# reading the csv file
data = pd.read_csv('homeprices.csv')
data

# fit multi linear regression model
multi_model = ols('price ~ area + bedrooms', data=data).fit()

# modify figure size
fig = plt.figure(figsize=(14, 8))

# creating regression plots
fig = sm.graphics.plot_regress_exog(multi_model, 'bedrooms', fig=fig)
Python3
# import packages and libraries
import pandas as pd
import seaborn as sns
import matplotlib.pyplot as plt

# reading the csv file
data = pd.read_csv('headbrain3.csv')

sns.residplot(x='Head_size', y='Brain_weight', data=data)

plt.show()
输出:
我们可以看到这些点是随机分布或分散的。点或残差散布在'0'线周围,没有模式,并且点不基于一侧,因此不存在异方差问题。使用预测变量“Head_size”没有异方差性。


多元线性回归:
在多元线性回归中,我们有多个自变量或预测变量和一个因变量。代码类似于线性回归,只是我们必须在 ols() 方法中进行此更改。
ols(‘response_variable ~ predictor_variable1+ predictor_variable2 +…. ‘, data= data)
'+' 用于在创建模型时添加我们想要多少个 predictor_variables。
使用的 CSV:房价
示例 1:
Python3
# import packages and libraries
import numpy as np
import pandas as pd
import matplotlib.pyplot as plt
import statsmodels.api as sm
from statsmodels.formula.api import ols

# reading the csv file
data = pd.read_csv('homeprices.csv')
data

# fit multi linear regression model
multi_model = ols('price ~ area + bedrooms', data=data).fit()

# display model summary
print(multi_model.summary())

# modify figure size
fig = plt.figure(figsize=(14, 8))

# creating regression plots
fig = sm.graphics.plot_regress_exog(multi_model, 'area', fig=fig)
输出:
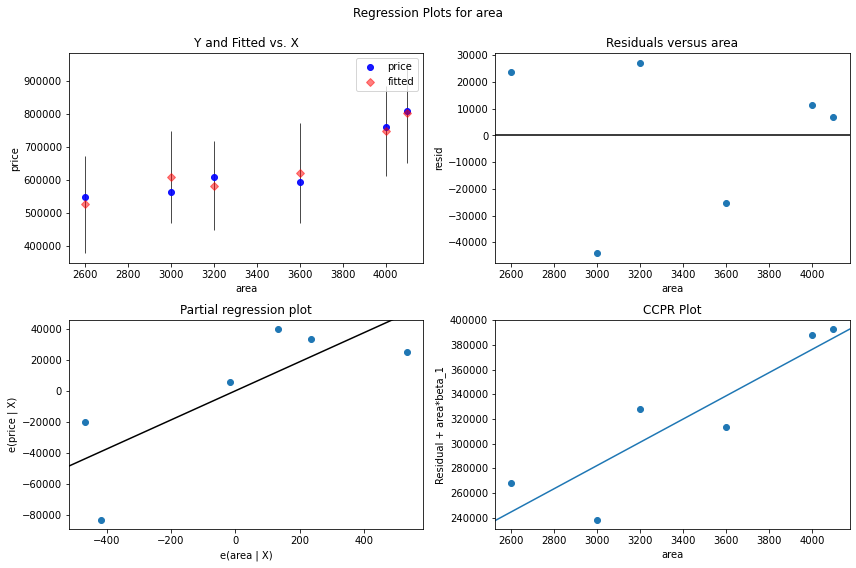
我们可以看到这些点是随机分布或分散的。点或残差散布在'0'线周围,没有模式,并且点不基于一侧,因此不存在异方差问题。使用预测变量“面积”,没有异方差性。


示例 2:
Python3
# import packages and libraries
import numpy as np
import pandas as pd
import matplotlib.pyplot as plt
import statsmodels.api as sm
from statsmodels.formula.api import ols

# reading the csv file
data = pd.read_csv('homeprices.csv')
data

# fit multi linear regression model
multi_model = ols('price ~ area + bedrooms', data=data).fit()

# modify figure size
fig = plt.figure(figsize=(14, 8))

# creating regression plots
fig = sm.graphics.plot_regress_exog(multi_model, 'bedrooms', fig=fig)
输出:
我们可以看到这些点是随机分布或分散的。点或残差散布在“0”线周围,没有模式,点也不基于一侧,因此不存在异方差问题。对于预测变量“卧室”,没有异方差性。

方法二:使用 seaborn.residplot()
seaborn.residplot():此函数将对 x 回归 y,然后将残差绘制为散点图。您可以选择将低平滑器拟合到残差图,这有助于检测残差是否具有结构。
Syntax: seaborn.residplot(*, x=None, y=None, data=None, lowess=False, x_partial=None, y_partial=None, order=1, robust=False, dropna=True, label=None, color=None, scatter_kws=None, line_kws=None, ax=None)
Parameters:
- x : column name of the independent variable (predictor) or a vector.
- y: column name of the dependent variable(response) or a vector.
- data: optional parameter. dataframe
- lowess: by default it’s false.
下面是一个简单的残差图示例,其中 x(自变量)是数据集中的 head_size,y(因变量)是数据集的 Brain_weight 列。
Python3
# import packages and libraries
import pandas as pd
import seaborn as sns
import matplotlib.pyplot as plt

# reading the csv file
data = pd.read_csv('headbrain3.csv')

sns.residplot(x='Head_size', y='Brain_weight', data=data)

plt.show()
输出:
我们可以看到点是随机分布的,没有模式,点也不是基于一侧,所以不存在异方差问题。
