社交网络中的空间隔离
先决条件 -社交网络简介
隔离是指将人与其他人或主要群体分开的行为。
空间隔离是指社会群体或任何其他元素在空间中的分布。在空间隔离中,人们倾向于迁移到其他地方,那里有更多像他们一样的邻居。
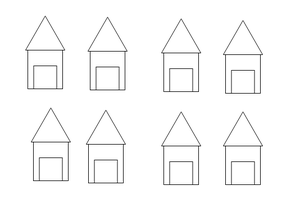
一个地方的房屋群
根据空间隔离,一个人不太可能住在一个邻居和你很不一样的地方,你也无法和邻居很好地交谈。一个人更有可能迁移到他/她的邻居与他们相似的地方,您可以与邻居进行良好的交谈。
举个例子——假设你去国外生活,你正在决定把房子搬到哪里。因此,您更有可能选择邻居来自您的国家并使用与您的国家相同的语言的地方或地点,而不是人们来自不同国家并使用不同语言的地方。这就是空间隔离。
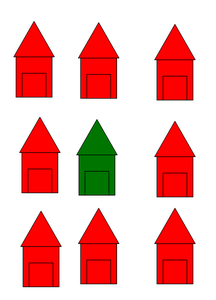
与您不同的邻居的位置
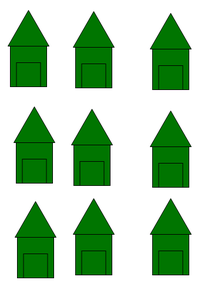
与您拥有相同邻居的地区
但有时不可能让所有邻居都和你一样。所以为此,我们可以有一些阈值让相似的邻居留在那里。
让我们举个例子——假设您所在地区共有 9 栋房屋,包括您的房屋,假设阈值为 3,这意味着至少有 3 栋房屋应该与您相似。
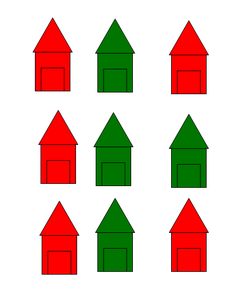
当 t =3 时,此人将留在这里
这种空间隔离已经被建模,这个模型被称为谢林模型。在 Schelling 模型中,有一个包含 2 种不同类型人的网格,并且模拟描述了如何使用一个很好的模型来完成空间隔离。下面是在Python中实现这种模拟。
例子:
创建一个 10×10 尺寸的网格用于演示。考虑用红色、绿色和白色区分的三组节点。现在基于 Schelling 模型,节点向与其相似的节点移动。这里的相似性是基于颜色的。迭代次数越多,不同邻居的数量越少。
Python3
#import modules
import networkx as nx
import matplotlib.pyplot as plt
import random

# grid dimension
n = 10

# Building the graph
g = nx.grid_2d_graph(10, 10)
pos = dict((s, s) for s in g.nodes())
labels = dict(((i, j), i * 10 + j) for i, j in g.nodes())

# Display the graph in grid form.
def display(g):
    nodes_g = nx.draw_networkx_nodes(
        g, pos, node_color='green', nodelist=type1_node_list)
    nodes_r = nx.draw_networkx_nodes(
        g, pos, node_color='red', nodelist=type2_node_list)
    nodes_w = nx.draw_networkx_nodes(
        g, pos, node_color='white', nodelist=empty_cells)
    nx.draw_networkx_edges(g, pos)
    nx.draw_networkx_labels(g, pos, labels=labels)
    plt.show()


# Get the boundary nodes in the graph as boundary nodes have only 6 neighbors.
def get_boundary(g):
    boundary_nodes_list = []
    for ((u, v), d) in g.nodes(data=True):
        if (u == 0 or v == n - 1 or u == n - 1 or v == 0):
            boundary_nodes_list.append((u, v))
    return boundary_nodes_list


# Get internal neighbors.
def get_internal_neigh(u, v):
    return (
        [(u - 1, v), (u + 1, v), (u, v - 1), (u, v + 1), (u - 1, v + 1),
         (u + 1, v - 1), (u - 1, v - 1), (u + 1, v + 1)])


# Get boundary neighbors.
def get_boundary_neigh(u, v):
    if (u == 0 and v == 0):
        return ([(0, 1), (1, 1), (1, 0)])
    elif (u == n - 1 and v == n - 1):
        return ([(n - 2, n - 2), (n - 1, n - 2), (n - 2, n - 1)])
    elif (u == n - 1 and v == 0):
        return ([(u - 1, v), (u, v + 1), (u - 1, v + 1)])
    elif (u == 0 and v == n - 1):
        return ([(u + 1, v), (u + 1, v - 1), (u, v - 1)])
    elif (u == 0):
        return ([(u, v - 1), (u, v + 1), (u + 1, v), (u + 1, v - 1), (u + 1, v + 1)])
    elif (v == n - 1):
        return ([(u, v - 1), (u - 1, v), (u + 1, v), (u - 1, v - 1), (u + 1, v - 1)])
    elif (u == n - 1):
        return ([(u - 1, v), (u, v - 1), (u, v + 1), (u - 1, v + 1), (u - 1, v - 1)])
    elif (v == 0):
        return ([(u - 1, v), (u + 1, v), (u, v + 1), (u - 1, v + 1), (u + 1, v + 1)])


# Get the list of unsatisfied nodes in the graph.
def get_unsatisfied_nodes_list(g, internal_nodes_list, boundary_nodes_list):
    unsatisfied_nodes_list = []
    t = 3
    for u, v in g.nodes():
        type_of_this_node = g.nodes[(u, v)]['type']

        if (type_of_this_node == 0):
            continue
        else:
            similar_nodes = 0
            if ((u, v) in internal_nodes_list):
                neigh = get_internal_neigh(u, v)
            elif ((u, v) in boundary_nodes_list):
                neigh = get_boundary_neigh(u, v)

            for each in neigh:
                if (g.nodes[each]['type'] == type_of_this_node):
                    similar_nodes += 1
            if (similar_nodes <= t):
                unsatisfied_nodes_list.append((u, v))

    return unsatisfied_nodes_list


# Make the node satisfied by shifting the position
# of unsatisfied node randomly and check if it becomes satisfied.
def make_a_node_satisfied(unsatisfied_nodes_list, empty_cells):
    if (len(unsatisfied_nodes_list) != 0):
        node_to_shift = random.choice(unsatisfied_nodes_list)
        new_position = random.choice(empty_cells)

        g.nodes[new_position]['type'] = g.nodes[node_to_shift]['type']
        g.nodes[node_to_shift]['type'] = 0
        labels[node_to_shift], labels[new_position] = labels[new_position],
        labels[node_to_shift]
    else:
        pass


# for adding diagonal edges
for (u, v) in g.nodes():
    if (u + 1 <= n - 1 and v + 1 <= n - 1):
        g.add_edge((u, v), (u + 1, v + 1))
    if (u + 1 <= n - 1 and v - 1 >= 0):
        g.add_edge((u, v), (u + 1, v - 1))


for ni in g.nodes():
    g.nodes[ni]['type'] = random.randint(0, 2)

type1_node_list = [ni for (ni, d) in g.nodes(data=True) if d['type'] == 1]
type2_node_list = [ni for (ni, d) in g.nodes(data=True) if d['type'] == 2]
empty_cells = [ni for (ni, d) in g.nodes(data=True) if d['type'] == 0]
display(g)

boundary_nodes_list = get_boundary(g)
internal_nodes_list = list(set(g.nodes()) - set(boundary_nodes_list))

unsatisfied_nodes_list = get_unsatisfied_nodes_list(g, internal_nodes_list,
                                                    boundary_nodes_list)


# Loop to move unsatisfied nodes
# vary the value of for loop to visualize different results
for i in range(10000):
    unsatisfied_nodes_list = get_unsatisfied_nodes_list(g, internal_nodes_list,
                                                        boundary_nodes_list)

    make_a_node_satisfied(unsatisfied_nodes_list, empty_cells)

    type1_node_list = [ni for (ni, d) in g.nodes(data=True) if d['type'] == 1]
    type2_node_list = [ni for (ni, d) in g.nodes(data=True) if d['type'] == 2]
    empty_cells = [ni for (ni, d) in g.nodes(data=True) if d['type'] == 0]

display(g)
输出:
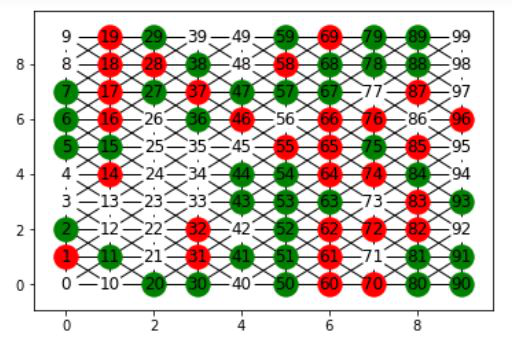
初始图
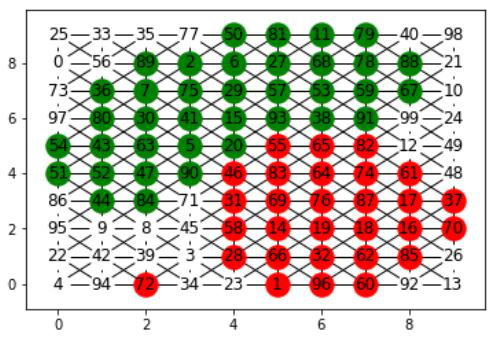
10,000 次迭代后