使用 ggplot2 在 R 中创建热图
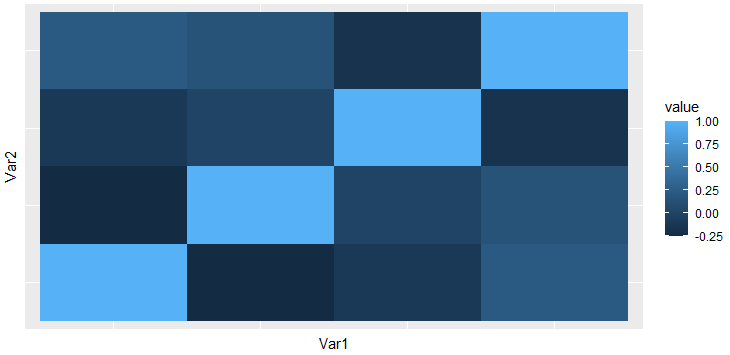
热图将数据帧的两个属性之间的关系描述为颜色编码的图块。热图生成具有数据帧多个属性的网格,表示一次获取的两个属性之间的关系。
使用的数据集:畅销书
让我们首先创建一个相关矩阵来理解不同属性之间的关系,因为使用了这个 cor()函数。
Syntax: cor(dataframe)
注意:当数据帧由数值以外的值组成时,此函数失败,因此我们还将使用 sapply() 方法。
例子:
R
df <- read.csv("bestsellers.csv")

cor(df[sapply(df, is.numeric)])
R
library(ggplot2)
library(reshape2)

df <- read.csv("bestsellers.csv")

data <- cor(df[sapply(df,is.numeric)])

data1 <- melt(data)

head(data1)
R
library(ggplot2)
library(reshape2)

df <- read.csv("bestsellers.csv")

data <- cor(df[sapply(df,is.numeric)])

data1 <- melt(data)

ggplot(data1, aes(x = Var1,
                  y = Var2,
                  fill = value))+geom_tile()
R
library(ggplot2)
library(reshape2)

df<-read.csv("bestsellers.csv")

data<-cor(df[sapply(df,is.numeric)])

data1<-melt(data)

ggplot(data1,aes(x = Var1, y = Var2, fill = value))+
geom_tile()+scale_fill_gradient(high = "green", low = "white")
R
library(ggplot2)
library(reshape2)

df<-read.csv("bestsellers.csv")

data<-cor(df[sapply(df, is.numeric)])

data1<-melt(data)

ggplot(data1,aes(x = Var1, y = Var2,fill = value))+
geom_tile() + scale_fill_distiller(palette = "Spectral")
R
library(ggplot2)
library(reshape2)
library(viridis)

df<-read.csv("bestsellers.csv")

data<-cor(df[sapply(df,is.numeric)])

data1<-melt(data)

ggplot(data1, aes(x = Var1, y = Var2, fill = value))+
geom_tile() + scale_fill_viridis(discrete = FALSE)
R
library(ggplot2)
library(reshape2)

df<-read.csv("bestsellers.csv")

data<-cor(df[sapply(df,is.numeric)])

data1<-melt(data)

ggplot(data1,aes(x = Var1, y = reorder(Var2, value),
                 fill = value)) + geom_tile()
R
library(ggplot2)
library(reshape2)

df<-read.csv("bestsellers.csv")

data<-cor(df[sapply(df,is.numeric)])

data1<-melt(data)

ggplot(data1, aes(x = Var1, y = Var2, fill = value))+
geom_tile()+ggtitle("Bestsellers")
R
library(ggplot2)
library(reshape2)

df<-read.csv("bestsellers.csv")

data<-cor(df[sapply(df,is.numeric)])

data1<-melt(data)

ggplot(data1,aes(x=Var1,y=Var2,fill=value))+geom_tile()+
  theme(axis.ticks = element_blank(),
        axis.text = element_blank())
输出:

现在我们有了一个相关矩阵,我们必须以一种可以创建热图的形式将它融化。使用 reshape2 库的这个melt()函数。
R 编程中的熔解是为了组织数据。它使用melt()函数,该函数采用必须保持不变的数据集和列值。使用melt() ,数据帧被转换成长格式并拉伸数据帧。
Syntax: melt(data, na.rm = FALSE, value.name = “value”)
Parameters:
- data: represents dataset that has to be reshaped
- na.rm: if TRUE, removes NA values from dataset
- value.name: represents name of variable used to store values
例子:
电阻
library(ggplot2)
library(reshape2)

df <- read.csv("bestsellers.csv")

data <- cor(df[sapply(df,is.numeric)])

data1 <- melt(data)

head(data1)
输出:

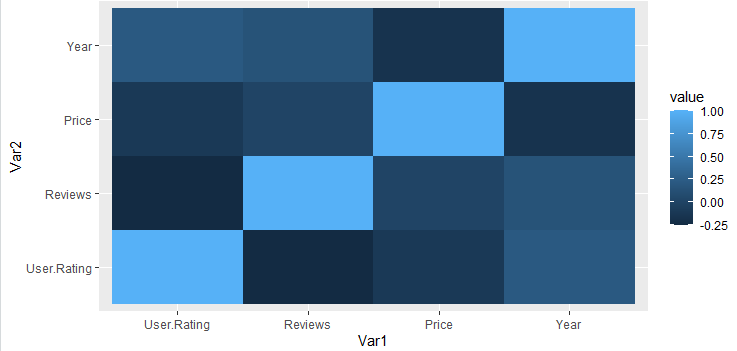
为了使用如此产生的融合数据创建热图,我们使用 ggplot2 库的 geom_tile()函数。它主要用于创建热图。
Syntax: geom_tile(x,y,fill)
Parameter:
- x: position on x-axis
- y: position on y-axis
- fill: numeric values that will be translated to colors
对于此函数,融合数据帧的 Var1 和 Var2 分别传递给 x 和 y。这些表示一次取两个属性之间的关系。提供填充参数,因为它将用于根据某个数值对图块进行颜色编码。
例子:
电阻
library(ggplot2)
library(reshape2)

df <- read.csv("bestsellers.csv")

data <- cor(df[sapply(df,is.numeric)])

data1 <- melt(data)

ggplot(data1, aes(x = Var1,
                  y = Var2,
                  fill = value))+geom_tile()
输出:
改变颜色:
可以使用三个函数更改绘图的颜色:
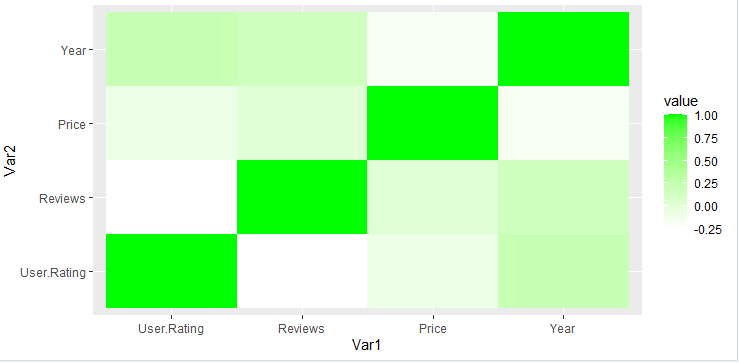
- scale_fill_gradient():为绘图添加极端颜色。
Syntax:
scale_fill_gradient(high, low)
Parameter:
- low: color to highlight smaller values
- high: color to highlight bigger values
电阻
library(ggplot2)
library(reshape2)

df<-read.csv("bestsellers.csv")

data<-cor(df[sapply(df,is.numeric)])

data1<-melt(data)

ggplot(data1,aes(x = Var1, y = Var2, fill = value))+
geom_tile()+scale_fill_gradient(high = "green", low = "white")
输出:
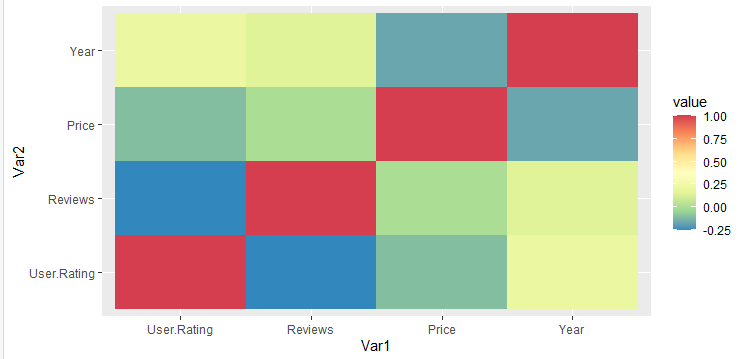
- scale_fill_distiller():用于根据 ColorBrewer 调色板进行自定义。
Syntax: scale_fill_distiller(palette)
电阻
library(ggplot2)
library(reshape2)

df<-read.csv("bestsellers.csv")

data<-cor(df[sapply(df, is.numeric)])

data1<-melt(data)

ggplot(data1,aes(x = Var1, y = Var2,fill = value))+
geom_tile() + scale_fill_distiller(palette = "Spectral")
输出:
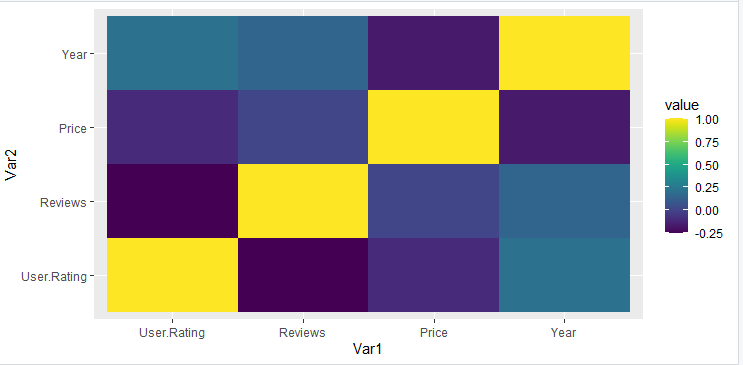
- scale_fill_viridis():使用 viridis。在此函数,离散设置为 FALSE。
Syntax: scale_fill_viridis(discrete)
电阻
library(ggplot2)
library(reshape2)
library(viridis)

df<-read.csv("bestsellers.csv")

data<-cor(df[sapply(df,is.numeric)])

data1<-melt(data)

ggplot(data1, aes(x = Var1, y = Var2, fill = value))+
geom_tile() + scale_fill_viridis(discrete = FALSE)
输出:
对行进行排序:
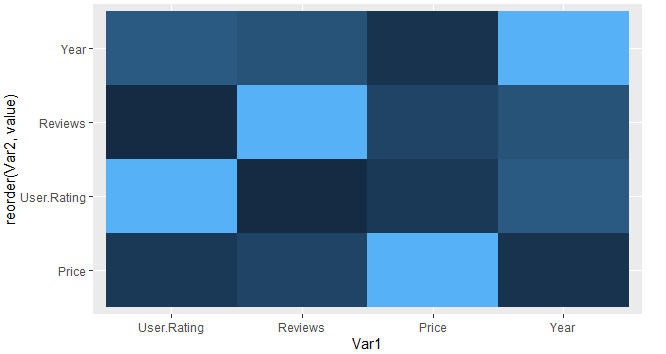
可以通过重新排序其 y 元素来重新排序热图。这可以通过 reorder() 来完成。
Syntax: reorder(y_value,value)
Where, Value is the element to reorder by.
电阻
library(ggplot2)
library(reshape2)

df<-read.csv("bestsellers.csv")

data<-cor(df[sapply(df,is.numeric)])

data1<-melt(data)

ggplot(data1,aes(x = Var1, y = reorder(Var2, value),
                 fill = value)) + geom_tile()
输出:
添加标题:
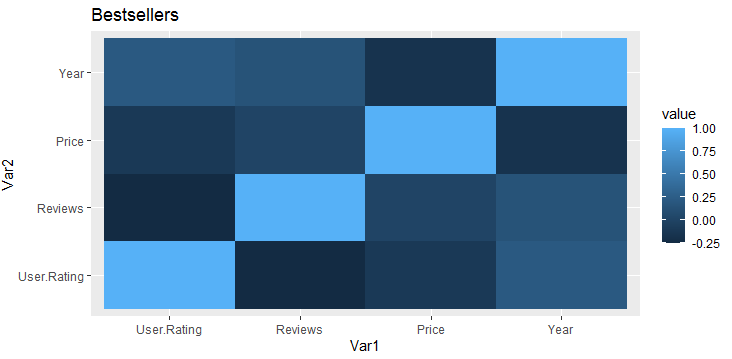
可以将标题添加到热图中以使其具有描述性。可以通过使用 ggtitle() 来完成。
Syntax: ggtitle(“title”)
电阻
library(ggplot2)
library(reshape2)

df<-read.csv("bestsellers.csv")

data<-cor(df[sapply(df,is.numeric)])

data1<-melt(data)

ggplot(data1, aes(x = Var1, y = Var2, fill = value))+
geom_tile()+ggtitle("Bestsellers")
输出:
去除标签:
也可以删除热图的标签以仅显示它所代表的相应值。如果我们删除标签,保持刻度线是没有意义的。我们可以使用 theme()函数axis.ticks 和axis.text 的属性并将它们设置为element_blank()。
Syntax: theme(axis.ticks = element_blank(), axis.text = element_blank())
电阻
library(ggplot2)
library(reshape2)

df<-read.csv("bestsellers.csv")

data<-cor(df[sapply(df,is.numeric)])

data1<-melt(data)

ggplot(data1,aes(x=Var1,y=Var2,fill=value))+geom_tile()+
  theme(axis.ticks = element_blank(),
        axis.text = element_blank())
输出:
