在 R 中使用 ggplot2 创建多个饼图
饼图,也称为圆图,是以圆形格式表示数据的相对大小或频率的图形表示。基本上,它有助于将特定数据组的相对大小或频率可视化为整体的一部分。本文讨论如何将多个饼图创建到一个框架中以进行连续比较。
使用的函数:
- 顾名思义, pie()函数用于可视化饼图。
Syntax: pie(x, labels, radius, main, col, clockwise)
Parameters:
- x: This parameter is the vector containing the value of the pie chart.
- labels: This parameter is the vector containing the labels of all the slices in Pie Chart.
- radius: This parameter is the value of the radius of the pie chart. This value is between -1 to 1.
- main: This parameter is the title of the chart.
- col: This parameter is the color used in the pie chart.
- clockwise: This parameter is the logical value which is used to draw the slices in clockwise or anti-clockwise direction.
- coord_polar()函数用于创建极坐标系,有助于绘制饼图。
Syntax:
coord_polar(theta = “x”, start = 0, direction = 1, clip = “on”)
Parameter:
- theta represents the angle
- start used for setting offset
- direction
- clip decides whether drawing should be clipped or not
- facet_grid() 创建一个矩阵来显示行和列分面变量
Syntax:
facet_grid(facets, margins=FALSE, scales=”fixed”, space=”fixed”, shrink=TRUE, labeller=”label_value”, as.table=TRUE, drop=TRUE)
让我们首先创建一个常规饼图
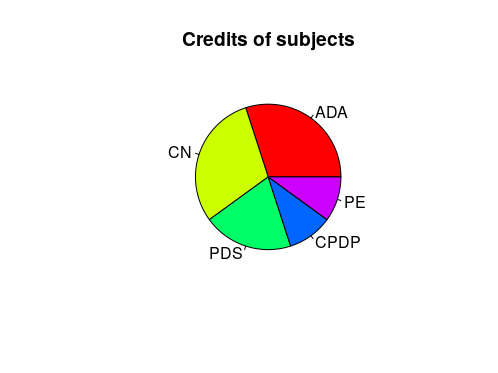
程序 1 : 常规饼图
R
x <- c(3,3,2,1,1)

labels <- c('ADA','CN','PDS','CPDP','PE')

pie(x, labels, main="Credits of subjects", col=rainbow(length(x)))
R
library(ggplot2)

df = data.frame(x <- c(3,3,2,1,1),
                labels <- c('ADA','CN','PDS','CPDP','PE'))

ggplot(df, aes(x="", y=x, fill=labels)) +geom_bar(width = 1, stat = "identity") +
  coord_polar("y", start=0) +theme_void()
R
library(ggplot2)
df = data.frame(subject <- c('ADA','ADA','ADA','CN','CN','CN','PDS','PDS','PDS','CPDP',
                         'CPDP','CPDP'),
                credit <- c('Midsem','Viva','Attendance','Midsem','Viva','Attendance',
                            'Midsem','Viva','Attendance','Midsem','Viva','Attendance'),
                value <- c(50,30,20,40,40,20,50,35,15,50,40,10))

df$subject <- factor(df$subject)
df$credit <- factor(df$credit)

ggplot(data=df, aes(x=" ", y=value, group=credit, colour=credit, fill=credit)) +
         geom_bar(width = 1, stat = "identity") +
         coord_polar("y", start=0) +
         facet_grid(.~ subject) +theme_void()
R
library(ggplot2)
df = data.frame(subject <- c('ADA','ADA','ADA','CN','CN','CN','PDS','PDS','PDS'),
                credit <- c('Midsem','Viva','Attendance','Midsem','Viva','Attendance',
                            'Midsem','Viva','Attendance'),
                value <- c(50,30,20,40,40,20,50,35,15))

df$subject <- factor(df$subject) # converts to a categorical variable
df$credit <- factor(df$credit) # converts to a categorical variable


ggplot(df, aes(x = subject, y = value, fill = credit)) +
  geom_col() +scale_x_discrete(limits = c(" ", "ADA","CN","PDS")) +coord_polar("y")
输出:

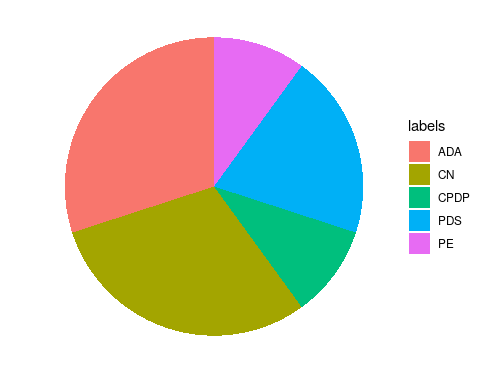
为了在 R 中构建饼图,我们可以使用 ggplot2 包,但它没有直接的方法来这样做。相反,我们绘制一个条形图,然后使用 coord_polar()函数将其转换为饼图。
方法:
- 导入库
- 创建数据
- 创建数据框
- 绘制条形图
- 将条形图转换为饼图
- 删除数值和网格
程序 2:使用 ggplot2 绘制饼图
电阻
library(ggplot2)

df = data.frame(x <- c(3,3,2,1,1),
                labels <- c('ADA','CN','PDS','CPDP','PE'))

ggplot(df, aes(x="", y=x, fill=labels)) +geom_bar(width = 1, stat = "identity") +
  coord_polar("y", start=0) +theme_void()
输出:

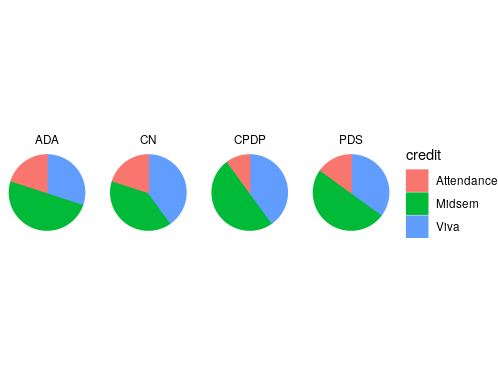
要使用 ggplot2 在 R 中绘制多个饼图,我们必须使用名为 facet_grid() 的附加方法。此方法形成由行和列分面变量定义的矩阵。当我们有两个不同的变量并且需要一个包含这两个变量的所有组合的矩阵时,我们使用这种方法。
方法:
- 导入库
- 创建数据框
- 将变量转换为分类变量
- 绘制条形图
- 转换成饼图
- 添加 facet_grid()
程序 3:多饼图
电阻
library(ggplot2)
df = data.frame(subject <- c('ADA','ADA','ADA','CN','CN','CN','PDS','PDS','PDS','CPDP',
                         'CPDP','CPDP'),
                credit <- c('Midsem','Viva','Attendance','Midsem','Viva','Attendance',
                            'Midsem','Viva','Attendance','Midsem','Viva','Attendance'),
                value <- c(50,30,20,40,40,20,50,35,15,50,40,10))

df$subject <- factor(df$subject)
df$credit <- factor(df$credit)

ggplot(data=df, aes(x=" ", y=value, group=credit, colour=credit, fill=credit)) +
         geom_bar(width = 1, stat = "identity") +
         coord_polar("y", start=0) +
         facet_grid(.~ subject) +theme_void()
输出:

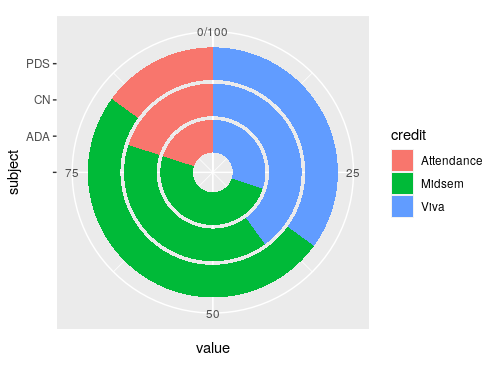
我们还可以使用 R 中的 ggplot2 以圆环图的形式绘制多个饼图。
方法:
- 导入库
- 创建数据框
- 将变量转换为分类变量
- 使用 geom_col() 绘制条形图
- 使用 scale_x_discrete() 在主题之前添加一个空元素
- 使用 coord_polar() 转换为饼图
程序 4:多饼图/圆环图
电阻
library(ggplot2)
df = data.frame(subject <- c('ADA','ADA','ADA','CN','CN','CN','PDS','PDS','PDS'),
                credit <- c('Midsem','Viva','Attendance','Midsem','Viva','Attendance',
                            'Midsem','Viva','Attendance'),
                value <- c(50,30,20,40,40,20,50,35,15))

df$subject <- factor(df$subject) # converts to a categorical variable
df$credit <- factor(df$credit) # converts to a categorical variable


ggplot(df, aes(x = subject, y = value, fill = credit)) +
  geom_col() +scale_x_discrete(limits = c(" ", "ADA","CN","PDS")) +coord_polar("y")
输出:
