在 Matplotlib 中更改绘图大小 – Python
先决条件: Matplotlib
绘图是一种直观地表示数据并以优美的方式对其进行总结的有效方式。然而,如果没有有效地绘制它似乎看起来很复杂。在 python 的 matplotlib 中,为了数据表示的目的提供了几个库。
在制作绘图时,优化其大小对我们来说很重要。以下是根据我们所需的尺寸更改默认绘图大小或调整给定绘图大小的各种方法。
方法一:使用 set_figheight() 和 set_figwidth()
为了改变绘图的高度和宽度,使用 set_figheight 和 set_figwidth
Python3
# importing the matplotlib library
import matplotlib.pyplot as plt

# values on x-axis
x = [1, 2, 3, 4, 5]
# values on y-axis
y = [1, 2, 3, 4, 5]

# naming the x and y axis
plt.xlabel('x - axis')
plt.ylabel('y - axis')

# plotting a line plot with it's default size
print("Plot in it's default size: ")
plt.plot(x, y)
plt.show()

# plotting a line plot after changing it's width and height
f = plt.figure()
f.set_figwidth(4)
f.set_figheight(1)

print("Plot after re-sizing: ")
plt.plot(x, y)
plt.show()
Python3
import matplotlib.pyplot as plt

# values on x and y axis
x = [1, 2, 3, 4, 5]
y = [6, 7, 8, 9, 10]

# plot in it's default size
display(plt.plot(x, y))

# changing the size of figure to 2X2
plt.figure(figsize=(2, 2))
display(plt.plot(x, y))
Python3
# importing the matplotlib library
import matplotlib.pyplot as plt
# values on x-axis
x = [1, 2, 3, 4, 5]
# values on y-axis
y = [1, 2, 3, 4, 5]
# naming the x axis
plt.xlabel('x - axis')
# naming the y axis
plt.ylabel('y - axis')
# plotting a line plot with it's default size
plt.plot(x, y)
plt.show()
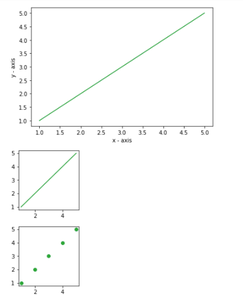
# changing the rc parameters and plotting a line plot
plt.rcParams['figure.figsize'] = [2, 2]
plt.plot(x, y)
plt.show()
plt.scatter(x, y)
plt.show()输出:

方法二: 使用 figsize
figsize() 有两个参数——宽度和高度(以英寸为单位)。默认情况下,宽度和高度的值分别为 6.4 和 4.8。
句法:
plt.figure(figsize=(x,y))
其中,x 和 y 分别以英寸为单位的宽度和高度。
蟒蛇3
import matplotlib.pyplot as plt

# values on x and y axis
x = [1, 2, 3, 4, 5]
y = [6, 7, 8, 9, 10]

# plot in it's default size
display(plt.plot(x, y))

# changing the size of figure to 2X2
plt.figure(figsize=(2, 2))
display(plt.plot(x, y))
输出:
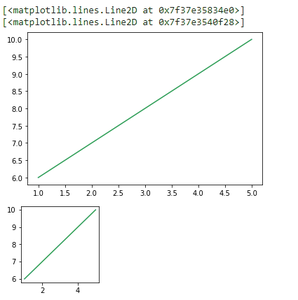
输出截图
方法 3:更改默认 rcParams
我们可以根据需要通过设置 figure.figsize 来永久更改图形的默认大小。
蟒蛇3
# importing the matplotlib library
import matplotlib.pyplot as plt

# values on x-axis
x = [1, 2, 3, 4, 5]
# values on y-axis
y = [1, 2, 3, 4, 5]

# naming the x axis
plt.xlabel('x - axis')
# naming the y axis
plt.ylabel('y - axis')

# plotting a line plot with it's default size
plt.plot(x, y)
plt.show()

# changing the rc parameters and plotting a line plot
plt.rcParams['figure.figsize'] = [2, 2]

plt.plot(x, y)
plt.show()

plt.scatter(x, y)
plt.show()
输出: