大量收集和分析数据的科学,特别是用于推断整体比例的科学,称为统计。 “统计”一词本身是指用于描述数据关系的数字。因此,可以说涉及数据收集,组织,分析,解释和表示的应用数学领域称为统计。
条形图或直方图是统计数据的图形表示。在条形图或直方图中,使用图形,图表和表格数据可以非常容易地理解数据之间的概念和关系。
条状图
组中数据的图形表示,水平或垂直条形图,其中条形图的长度表示轴上存在的数据值。它们(条形图)通常用于显示或传递属于“分类数据”的信息,即;符合某些类别的数据。
读取条形图并比较两组数据
为了阅读条形图,我们需要问自己一些问题,看看显示的图。让我们通过一个非常基本的示例来理解条形图,
人们喜欢的不同类型的水果,

What does the X-axis and Y-axis on the graph are representing?
The X-axis represents the different types of fruits like apple, guava. while Y-axis represents the Number of people.
What is the Common base for the Bars?
The bars are showing a common base of category of fruits.
What is the scale used on the Y-axis?
The scale used is normal, i.e; 1 Unit = 1 person
Overall, what kind of information the bar graph displaying?
The bar graph is displaying the number of People liking different types of fruits.
Looking at the bar Graph, can one answer, how many people like Mango?
Yes, By observing the length of the bar, one can tell that there are 5 people who like Mango.
比较两组数据
Noticing the graph, explain the fruit liked by most people and the fruit liked by least people?
The data displayed on the graph is easily comparable, it can be concluded that the most liked fruit is Guava and the least liked fruit is Apple.
How many more people like Guava than Mango?
There are 7 people who like guava and 5 who like Mango. Thus, we can say that there are 2 more people liking guava.
只需看一下图形就可以得出以下结论:
- 4个人喜欢苹果。
- 7个人喜欢番石榴。
- 6人们喜欢香蕉。
- 5个人喜欢芒果。
条形图的属性
- 所有酒吧都有一个共同的基础。
- 每个条的长度对应于在轴(垂直图的Y轴,水平图的X轴)上提到的其各自的数据。
- 每个显示的条具有相同的宽度。
- 连续条之间的距离是相同的
条形图的意义
从视觉上理解某些东西总是比查看大型数值数据表更容易,更舒适。条形图广泛用于演示和报告中。它在汇总数据并以频率分布显示时非常突出地使用。
条形图上的样本问题
问题1:为下表绘制条形图,

解决方案:
The Bar Graph for the following table is,

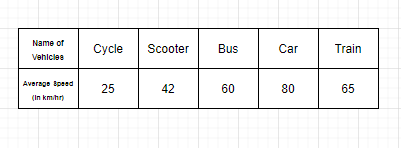
问题2:某些车辆的平均速度如下图所示,用条形图表示。

解决方案:
The average speed mentioned in the table is the frequency which decides the length of each bar graph, therefore, if the graph is vertical, the Average speed will be shown on the y-axis and the types of vehicles will be shown on the x-axis.

直方图
直方图是在条形图的帮助下数据的图形显示,条形图的高度可能会因数据不同而有所不同。直方图的相似度类似于条形图,但直方图将数字分为不同的范围。每个条的长度告诉您每个范围内有多少个,可以决定要使用哪个范围。
直方图的构造和解释
- 首先,在X轴上标记类别间隔,在Y轴上标记频率。
- 确保两个轴的比例相同。
- 间隔时间等级应始终是排他的。
- 在x轴上创建具有类间隔的条形图,在y轴上创建具有相应频率的条形图。
- 当间隔相等时,每个条的长度反映了频率。
- 当间隔不相等时,每个条的面积与其各自的频率相同。
直方图和条形图之间的差异
- 条形图是一维图形,而直方图是二维图形。
- 在条形图中,条的长度表示频率,但是宽度没有特殊意义,但是在直方图中,频率由条的面积表示。
- 在条形图中,条形图以相等的间距彼此隔开,而在直方图中,条形图始终相互接触。
直方图上的样本问题
问题1:在公园中,有28棵不同高度的树木,这些高度可以以厘米为单位进行测量,树木的范围在100-350厘米之间。绘制以下数据的直方图,

解决方案:
Since the height of the trees are lying between 100-350, we shall start by marking the heights on x-axis in groups of 50cm each and the number of trees will be mentioned on y-axis.
Therefore, if a tree has a height of 230 cm, it will lie in the rectangle 200-250.

问题2:在下表中,显示了在工厂固定时间内工作的机器数量。绘制直方图以获取以下数据。

解决方案:
The Histogram for the table mentioned above will have class intervals of 5 minutes on x-axis and the number of machines used should be on y-axis.
