集中趋势是代表整个数据集的单个值或平均值。它被称为数据分发的中心位置。表示为集中趋势的值在数据范围内。有3种集中趋势的度量。他们是:
- 均值(x̅或μ)
- 中位数(M)
- 模式(Z)
吝啬的
平均值是数据集中所有值的总和除以数据集中值的数量。也称为算术平均值。如果x 1, x 2, x 3 ,……,x n是数据集的值,则平均值表示为x is(x bar),公式计算如下:
x̅=(x 1 + x 2 + x 3 +……+ x n )/ n
例子:
The mean of the data 10, 30, 40, 20, 50 is
Mean = (sum of all data values) / (number of values)
Mean = (10 + 30 + 40 + 20+ 50) / 5=30
中位数
中位数是排序数据的中间值。数据的排序可以升序或降序进行。中位数将数据分为两半。中位数的公式:
如果数据集中的值个数(n个值)为奇数,则用于计算中位数的公式为:
中位数=((n + 1)/ 2)个项
如果数据集中的值个数(n个值)为偶数,则计算中位数的公式为:
中位数= [第(n / 2)个项+ {(n / 2)+ 1}个项] / 2
范例1:
The median of the data 30, 40, 10, 20, 50 is:
Step 1: Order the given data in ascending order as:
10, 20, 30, 40, 50
Step 2: Check n (number of terms of data set) is even or odd and find the median of the data with respective ‘n’ value.
Step 3: Here, n = 5 (odd) then Median = [(n + 1)/2]th term 10, 20, 30, 40, 50
The median of the data is [(5 + 1)/2]th term is 30.
范例2:
25, 12, 5, 24, 15, 22, 23, 25
Step 1: Order the given data in ascending order as:
5, 12, 15, 22, 23, 24, 25, 25
Step 2: Check n (number of terms of data set) is even or odd and find the median of the data with respective ‘n’ value.
Step 3: Here, n = 8 (even) then,
Median = [(n/2)th term + {(n/2) + 1)th term] / 2
Median = [(8/2)th term + {(8/2) + 1}th term] / 2 = (22+23) / 2 = 22.5
模式
模式是数据集中最频繁的值或项目。数据集通常可以具有一个或多个模式值。如果数据集具有一种模式,则称为“单模式”。同样,如果数据集包含2个模式,则称为“双峰”,如果数据集包含3个模式,则称为“三峰”。如果数据集包含多个模式,则称为“多峰”(可以是双峰或三峰)。如果每个数字仅出现一次,则没有任何数据集模式。
范例1:
If the data set is {1, 2, 2, 3, 3, 4, 5} then it has 2 modes i.e, 2 and 3 (bi-modal). Since, both the values 2 and 3 are repeating twice in the data set.
范例2:
If the data set is {15, 42, 65, 65, 95} then the mode is 65 (uni-modal). Since 65 is the only repeating value in the data set.
范围
它是最大值和最小值之间的差。这是一种理解数字在数据集中的分布方式的方法。查找范围的公式是:
范围=最高值–最低值
例子:
If the data set is {12, 19, 6, 2, 15, 4} then the lowest value is 2 and the highest value is 19.
So the range is 19 − 2 = 17.
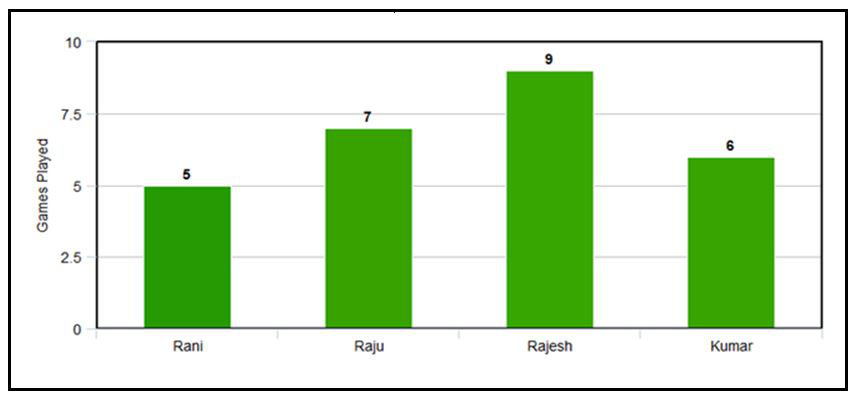
阅读条形图:将其与中心趋势放在一起

问题1.上面条形图的均值。
Mean = (sum of all data values) / (number of values)
Mean = (5 + 7 + 9 + 6) / 4 = 27 / 2 = 6.75
问题2.找到上述条形图的中位数:
Order the given data in ascending order as: 5, 6, 7, 9
Here, n = 4 (number of students which is even)
Median = [(n/2)th term + {(n/2) + 1}th term] / 2
Median = (6 + 7) / 2 = 6.5
问题3.上面条形图的查找模式:
Mode = most frequent value = 9 (highest value)
问题4.查找以上条形图的范围:
Range = highest value – lowest value
Range = 9 – 5 = 4