R 编程中的均值、中值和众数
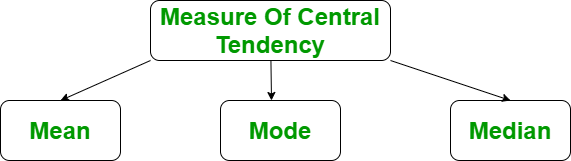
R 语言中的集中趋势度量用单个值表示整个数据集。它为我们提供了中心点的位置。集中趋势的三个主要指标:
- 意思是
- 中位数
- 模式
先决条件:
在进行任何计算之前,首先,我们需要准备数据,将数据保存在外部 .txt 或 .csv 文件中,最好将文件保存在当前目录中。导入后,您的数据到 R 中,如下所示:
在此处获取 CSV 文件。
R
# R program to import data into R

# Import the data using read.csv()
myData = read.csv("CardioGoodFitness.csv",
                  stringsAsFactors=F)
# Print the first 6 rows
print(head(myData))
R
# R program to illustrate
# Descriptive Analysis

# Import the data using read.csv()
myData = read.csv("CardioGoodFitness.csv",
                  stringsAsFactors=F)

# Compute the mean value
mean = mean(myData$Age)
print(mean)
R
# R program to illustrate
# Descriptive Analysis

# Import the data using read.csv()
myData = read.csv("CardioGoodFitness.csv",
                  stringsAsFactors=F)

# Compute the median value
median = median(myData$Age)
print(median)
R
# Import the data using read.csv()
myData = read.csv("CardioGoodFitness.csv",
                  stringsAsFactors=F)

mode = function(){
    return(sort(-table(myData$Age))[1])
}

mode()
R
# R program to illustrate
# Descriptive Analysis

# Import the library
library(modest)

# Import the data using read.csv()
myData = read.csv("CardioGoodFitness.csv",
                  stringsAsFactors=F)

# Compute the mode value
mode = mfv(myData$Age)
print(mode)
输出:
Product Age Gender Education MaritalStatus Usage Fitness Income Miles
1   TM195  18   Male        14        Single     3       4  29562   112
2   TM195  19   Male        15        Single     2       3  31836    75
3   TM195  19 Female        14     Partnered     4       3  30699    66
4   TM195  19   Male        12        Single     3       3  32973    85
5   TM195  20   Male        13     Partnered     4       2  35247    47
6   TM195  20 Female        14     Partnered     3       3  32973    66
R 编程语言中的均值
它是观测值的总和除以观测值的总数。它也被定义为平均值,即总和除以计数。
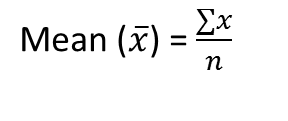
其中, n = 项数
例子:
R
# R program to illustrate
# Descriptive Analysis

# Import the data using read.csv()
myData = read.csv("CardioGoodFitness.csv",
                  stringsAsFactors=F)

# Compute the mean value
mean = mean(myData$Age)
print(mean)
输出:
[1] 28.78889R 编程语言中的中位数
它是数据集的中间值。它将数据分成两半。如果数据集中元素的数量是奇数,则中心元素是中值,如果是偶数,则中值将是两个中心元素的平均值。
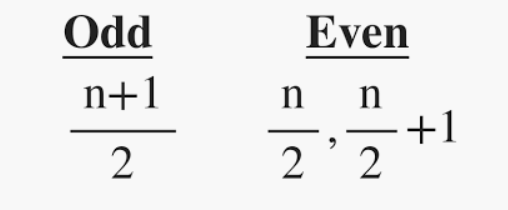
其中n = 项数
Syntax: median(x, na.rm = False)
Where, X is a vector and na.rm is used to remove missing value
例子:
R
# R program to illustrate
# Descriptive Analysis

# Import the data using read.csv()
myData = read.csv("CardioGoodFitness.csv",
                  stringsAsFactors=F)

# Compute the median value
median = median(myData$Age)
print(median)
输出:
[1] 26R 编程语言中的模式
它是给定数据集中频率最高的值。如果所有数据点的频率相同,则数据集可能没有众数。此外,如果我们遇到两个或多个具有相同频率的数据点,我们可以有多个模式。 R 中没有用于查找模式的内置函数,因此我们可以创建自己的函数来查找模式,也可以使用名为modem 的包。
创建用于查找模式的用户定义函数
R 中没有用于查找模式的内置函数。因此,让我们创建一个用户定义的函数,该函数将返回传递的数据的模式。我们将为此使用 table() 方法,因为它以表格的形式创建具有变量名称和频率的数据的分类表示。我们将按降序对 Age 列进行排序,并从排序后的值中返回 1 值。
示例:通过对数据框的列进行排序来查找模式
R
# Import the data using read.csv()
myData = read.csv("CardioGoodFitness.csv",
                  stringsAsFactors=F)

mode = function(){
    return(sort(-table(myData$Age))[1])
}

mode()
输出:
25: -25使用谦虚的包
我们可以使用 R 的适度包。这个包提供了找到单变量数据的众数和通常概率分布的众数的方法。
例子:
R
# R program to illustrate
# Descriptive Analysis

# Import the library
library(modest)

# Import the data using read.csv()
myData = read.csv("CardioGoodFitness.csv",
                  stringsAsFactors=F)

# Compute the mode value
mode = mfv(myData$Age)
print(mode)
输出:
[1] 25