Mahotas – 创建 RGB 图像
在本文中,我们将了解如何在 mahotas 中创建 RGB 图像。 RGB 图像(有时称为真彩色图像)作为 m×n×3 数据数组存储在 MATLAB 中,该数组定义了每个像素的红色、绿色和蓝色分量。 RGB 图像可以在每个通道的数组的帮助下创建。
In order to do this we will use as_rgb method
Syntax : mahotas.as_rgb(r, g, b)
Argument : It takes three numpy array as argument
Return : It returns RGB ndarray object
下面是实现
# importing required libraries
import mahotas
import mahotas.demos
from pylab import gray, imshow, show
import numpy as np

# creating array of shape 50x50
# for red channel
r = np.arange(2500).reshape(50, 50)

# for blue channel
g = np.arange(2500).reshape(50, 50)

# for blue channel
b = np.arange(2500).reshape(50, 50)

# making red channel values to 0
r = r * 0

# increasing green channel values
g = g * 100

# making blue channel values to 0
b = b * 0

# creating rgb image from these three channel
img = mahotas.as_rgb(r, g, b)

# showing image
imshow(img)
show()
输出 : 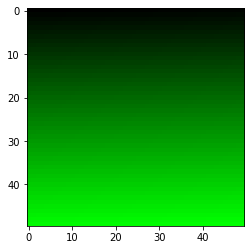
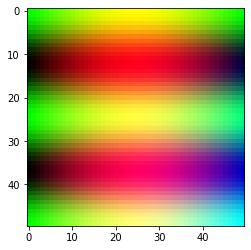
另一个例子
# importing required libraries
import mahotas
import mahotas.demos
from pylab import gray, imshow, show
import numpy as np

# creating numpy linspace
z1 = np.linspace(0, np.pi)

# creating numpy meshgrid
X, Y = np.meshgrid(z1, z1)

# creating rgb channels
# creating red channel through sin function
red = np.sin(X)

# creating green channel through cos function
green = np.cos(4 * Y)

# creating blue channel
blue = X * Y

# creating rgb image from these three channel
img = mahotas.as_rgb(red, green, blue)

# showing image
imshow(img)
show()
输出 :