在Python中使用 Plotly 绘制 3D Streamtube 绘图
Plotly是一个Python库,用于设计图形,尤其是交互式图形。它可以绘制各种图形和图表,如直方图、条形图、箱线图、散布图等等。它主要用于数据分析和财务分析。 plotly 是一个交互式可视化库。
3D 流管图
在 plotly 中,流管图,参数包括 X、Y 和 Z,它们用向量场设置坐标。 U、V 和 W 设置矢量场的 X、Y 和 Z 分量。流管是由流线包围的管状区域,流线形成闭环。
Syntax: plotly.graph_objects.Streamtube(arg=None, hoverinfo=None, showscale=None, u=None, v=None, w=None, x=None, y=None, z=None, **kwargs)
Parameters:
arg: dict of properties compatible with this constructor or an instance of plotly.graph_objects.Streamtube
hoverinfo: Determines which trace information appear on hover. If none or skip are set, no information is displayed upon hovering. But, if none is set, click and hover events are still fired.
showscale: Determines whether or not a colorbar is displayed for this trace.
u: Sets the x components of the vector field.
v: Sets the y components of the vector field.
w: Sets the z components of the vector field.
x: Sets the x coordinates of the vector field.
y: Sets the y coordinates of the vector field.
z: Sets the z coordinates of the vector field.
例子:
Python3
import plotly.graph_objects as go

fig = go.Figure(data=go.Streamtube(x=[1, 1, 1], y=[1, 1, 2],
                                   z=[0, 0, 0], u=[0, 0, 0],
                                   v=[1, 1, 1], w=[0, 0, 0]))
fig.show()
Python3
import plotly.graph_objects as go
import numpy as np

x, y, z = np.mgrid[0:20, 0:20, 0:20]
x = x.flatten()
y = y.flatten()
z = z.flatten()

u = np.zeros_like(x)
v = np.zeros_like(y)
w = z**2

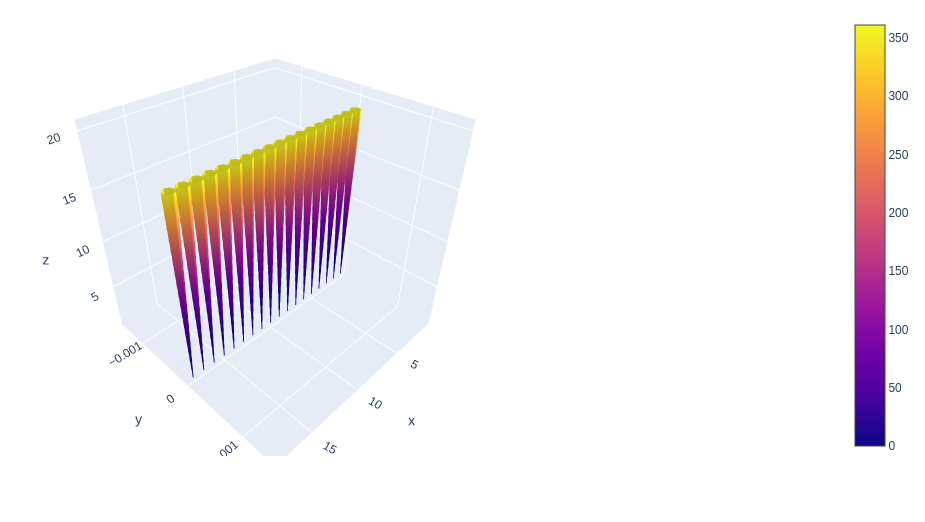
fig = go.Figure(data=go.Streamtube(x=x, y=y, z=z, u=u, v=v, w=w))
fig.show()
输出:

改变管径
管的直径可以通过矢量场的局部发散来确定。范数是成比例的,但向量的方向不同,会导致不同的散度场。
例子:
Python3
import plotly.graph_objects as go
import numpy as np

x, y, z = np.mgrid[0:20, 0:20, 0:20]
x = x.flatten()
y = y.flatten()
z = z.flatten()

u = np.zeros_like(x)
v = np.zeros_like(y)
w = z**2

fig = go.Figure(data=go.Streamtube(x=x, y=y, z=z, u=u, v=v, w=w))
fig.show()
输出:
