在Python中使用 Plotly 绘制 3D 圆锥图
Plotly是一个Python库,用于设计图形,尤其是交互式图形。它可以绘制各种图形和图表,如直方图、条形图、箱线图、散布图等等。它主要用于数据分析和财务分析。 plotly 是一个交互式可视化库。
Plotly 中的 3D 圆锥图
在 plotly 中,锥形图是具有 3d 等效于 2D 箭袋图的图。 3d 向量表示向量的方向和范数。
- 3d 坐标是定义向量坐标的 X、Y 和 Z。
- 矢量场的 3d 坐标是 U、V 和 W,它们被定义为矢量场。
Syntax: plotly.graph_objects.Cone(arg=None, anchor=None, autocolorscale=None, cauto=None, cmax=None, cmid=None, cmin=None, coloraxis=None, colorbar=None, colorscale=None, customdata=None, customdatasrc=None, hoverinfo=None, hoverinfosrc=None, hoverlabel=None, hovertemplate=None, hovertemplatesrc=None, hovertext=None, hovertextsrc=None, ids=None, idssrc=None, legendgroup=None, lighting=None, lightposition=None, meta=None, metasrc=None, name=None, opacity=None, reversescale=None, scene=None, showlegend=None, showscale=None, sizemode=None, sizeref=None, stream=None, text=None, textsrc=None, u=None, uid=None, uirevision=None, usrc=None, v=None, visible=None, vsrc=None, w=None, wsrc=None, x=None, xsrc=None, y=None, ysrc=None, z=None, zsrc=None, **kwargs)
Parameters:
u – Sets the x components of the vector field.
v – Sets the y components of the vector field.
w – Sets the z components of the vector field.
x – Sets the x coordinates of the vector field and of the displayed cones.
y – Sets the y coordinates of the vector field and of the displayed cones.
z – Sets the z coordinates of the vector field and of the displayed cones.
例子:
Python3
import plotly.graph_objects as go

fig = go.Figure(data=go.Cone(x=[3],
                             y=[1],
                             z=[4],
                             u=[1],
                             v=[7],
                             w=[2]))

fig.show()
Python3
import plotly.graph_objects as go

fig = go.Figure(data=go.Cone(x=[1,3],
                             y=[1,3],
                             z=[1,4],
                             u=[1,6],
                             v=[1,7],
                             w=[0,2]))

fig.show()
Python3
import plotly.graph_objects as go

fig = go.Figure(data=go.Cone(x=[11,31, 12],
                             y=[12,32, 21],
                             z=[13,41, 15],
                             u=[14,16, 17],
                             v=[15,27, 10],
                             w=[10,29, 21]))

fig.show()
输出:

绘制多个 3D 锥体
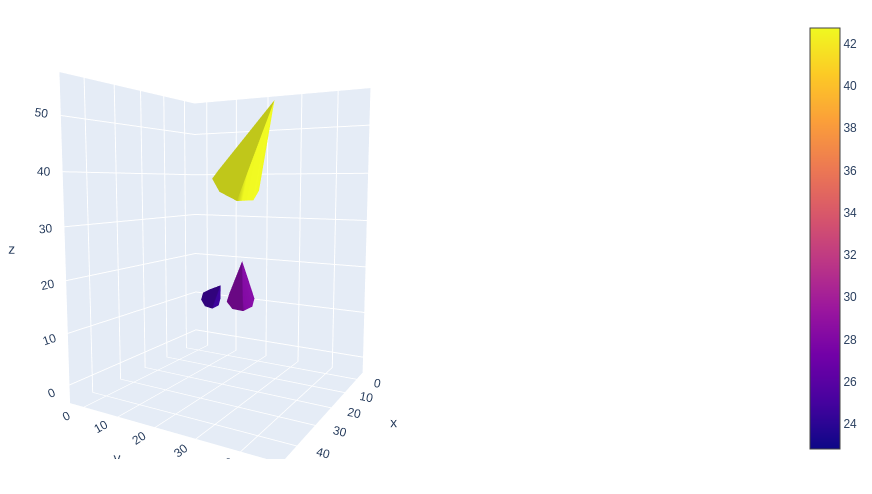
在 plotly 中,多个 3d 锥体使用参数场景,在此图中,在单个图中显示了许多锥体,有助于相互区分。它可以通过在 x、y、z、u、v、w 参数中传递多个值来创建。
示例 1:
Python3
import plotly.graph_objects as go

fig = go.Figure(data=go.Cone(x=[1,3],
                             y=[1,3],
                             z=[1,4],
                             u=[1,6],
                             v=[1,7],
                             w=[0,2]))

fig.show()
输出:

示例 2:
Python3
import plotly.graph_objects as go

fig = go.Figure(data=go.Cone(x=[11,31, 12],
                             y=[12,32, 21],
                             z=[13,41, 15],
                             u=[14,16, 17],
                             v=[15,27, 10],
                             w=[10,29, 21]))

fig.show()
输出:
