在Python中使用 Plotly 绘制饼图
Plotly是一个Python库,用于设计图形,尤其是交互式图形。它可以绘制各种图形和图表,如直方图、条形图、箱线图、散布图等等。它主要用于数据分析和财务分析。 plotly 是一个交互式可视化库。
饼图
饼图是一种圆形分析图,它被划分为区域来表示数字百分比。在 px.pie 中,饼图扇区预期用于设置值的数据。所有部门都按名称分类。饼图通常用于显示下一个相应饼图的百分比。由于其不同的部分和颜色编码,饼图有助于更好地理解。
Syntax: plotly.express.pie(data_frame=None, names=None, values=None, color=None, color_discrete_sequence=None, color_discrete_map={}, hover_name=None, hover_data=None, custom_data=None, labels={}, title=None, template=None, width=None, height=None, opacity=None, hole=None)
参数:Name Value Description data_frame DataFrame or array-like or dict This argument needs to be passed for column names (and not keyword names) to be used. Array-like and dict are transformed internally to a pandas DataFrame. Optional: if missing, a DataFrame gets constructed under the hood using the other arguments names str or int or Series or array-like Either a name of a column in data_frame, or a pandas Series or array_like object. Values from this column or array_like are used as labels for sectors. values str or int or Series or array-like Either a name of a column in data_frame, or a pandas Series or array_like object. Values from this column or array_like are used to set values associated to sectors. color str or int or Series or array-like Either a name of a column in data_frame, or a pandas Series or array_like object. Values from this column or array_like are used to assign color to marks.
例子:
Python3
import plotly.express as px
import numpy

# Random Data
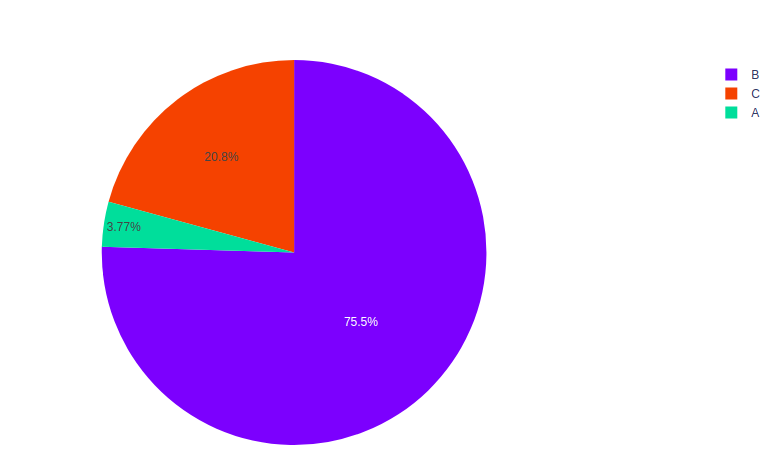
random_x = [100, 2000, 550]
names = ['A', 'B', 'C']

fig = px.pie(values=random_x, names=names)
fig.show()
Python3
import plotly.express as px

# Loading the iris dataset
df = px.data.iris()

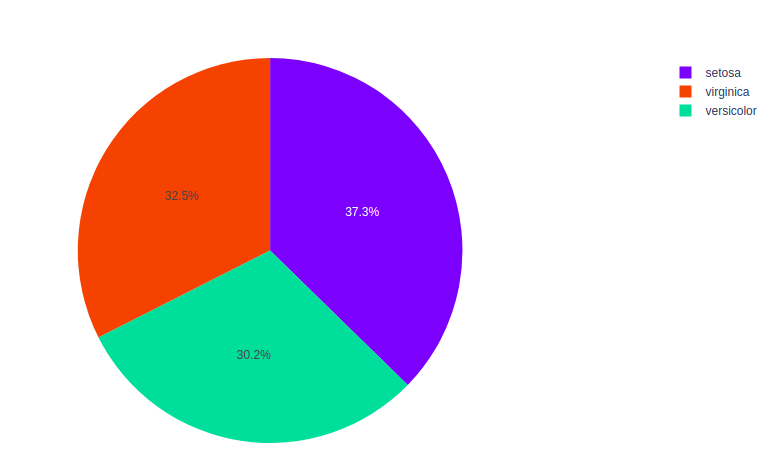
fig = px.pie(df, values="sepal_width", names="species")
fig.show()
Python3
import plotly.express as px

# Loading the iris dataset
df = px.data.iris()

fig = px.pie(df, values="sepal_width", names="species",
             title='Iris Dataset', hover_data=['sepal_length'])
fig.show()
Python3
import plotly.express as px

# Loading the iris dataset
df = px.data.iris()

fig = px.pie(df, values="sepal_width",
             names="species",
             color_discrete_sequence=px.colors.sequential.RdBu)
fig.show()
输出:

分组数据
names 参数的相同值被组合在一起。重复的标签在视觉上将行或列分组在一起,使数据更易于理解。让我们看看下面给出的一个例子。
示例:鸢尾花数据集包含许多行,但只有 3 个物种,因此数据根据物种进行分组。
Python3
import plotly.express as px

# Loading the iris dataset
df = px.data.iris()

fig = px.pie(df, values="sepal_width", names="species")
fig.show()
输出:

自定义饼图
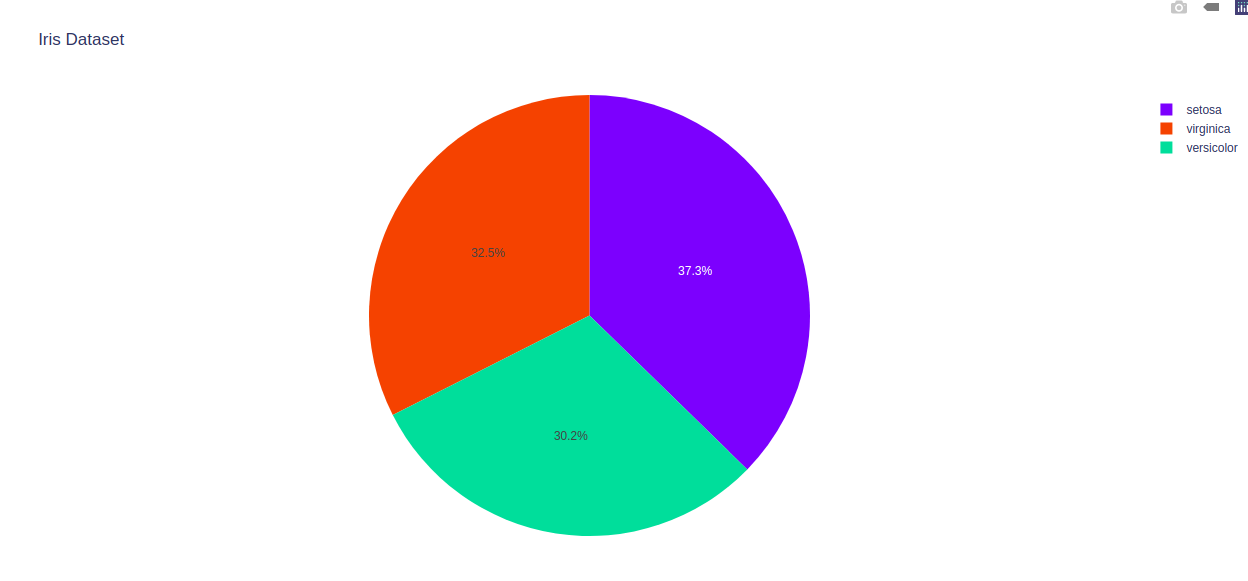
可以使用 px.pie 自定义饼图,使用它的一些参数,例如 hover_data 和标签。让我们看下面的示例以更好地理解。
例子:
Python3
import plotly.express as px

# Loading the iris dataset
df = px.data.iris()

fig = px.pie(df, values="sepal_width", names="species",
             title='Iris Dataset', hover_data=['sepal_length'])
fig.show()
输出:

设置颜色
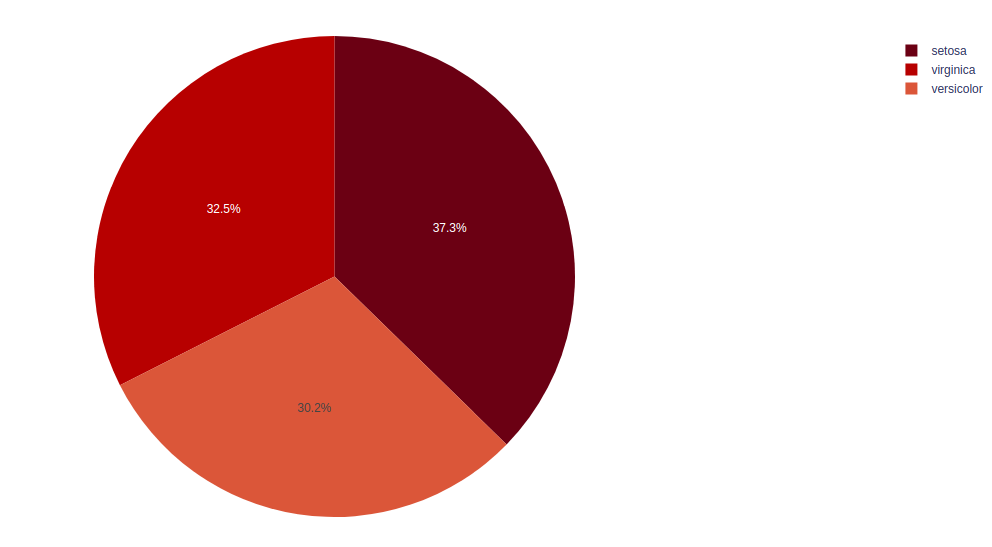
饼图的颜色可以在 plotly 模块中改变。不同的颜色有助于区分数据,这有助于更有效地理解数据。
例子:
Python3
import plotly.express as px

# Loading the iris dataset
df = px.data.iris()

fig = px.pie(df, values="sepal_width",
             names="species",
             color_discrete_sequence=px.colors.sequential.RdBu)
fig.show()
输出:
