在Python中使用 Plotly 绘制 3D 网格图
Plotly 是一个Python库,用于设计图形,尤其是交互式图形。它可以绘制各种图形和图表,如直方图、条形图、箱线图、展开图等等。它主要用于数据分析以及财务分析。 plotly 是一个交互式可视化库
3D 网格图
网格图是具有三个维度的曲面并且具有实心边缘且没有面颜色的图。网格图是一种创建 3D 三角形集的方法,其顶点由 x、y 和 z 给出。如果只有坐标,则使用Delaunay三角剖分等算法形成三角形。 I、J 和 K 参数也可用于创建三角形。
Syntax: class plotly.graph_objects.Mesh3d(arg=None, hoverinfo=None, x=None, y=None, z=None, **kwargs)
Parameters:
arg: dict of properties compatible with this constructor or an instance of plotly.graph_objects.Mesh3d
hoverinfo: Determines which trace information appear on hover. If none or skip are set, no information is displayed upon hovering. But, if none is set, click and hover events are still fired.
x: Sets the X coordinates of the vertices. The nth element of vectors x, y and z jointly represent the X, Y and Z coordinates of the nth vertex.
y: Sets the Y coordinates of the vertices. The nth element of vectors x, y and z jointly represent the X, Y and Z coordinates of the nth vertex.
z: Sets the Z coordinates of the vertices. The nth element of vectors x, y and z jointly represent the X, Y and Z coordinates of the nth vertex.
示例 1:
Python3
import plotly.graph_objects as go
import numpy as np
# Data for three-dimensional scattered points
z = 15 * np.random.random(100)
x = np.sin(z) + 0.1 * np.random.randn(100)
y = np.cos(z) + 0.1 * np.random.randn(100)
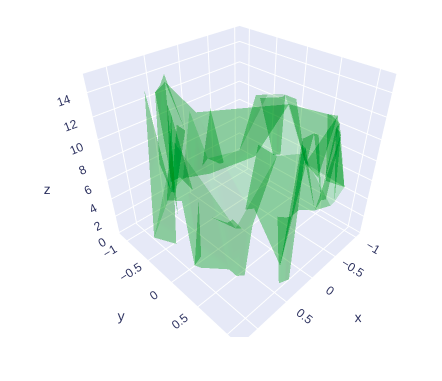
fig = go.Figure(data=[go.Mesh3d(
x=x, y=y, z=z, color='green', opacity=0.20)])
fig.show()Python3
import plotly.graph_objects as go
import numpy as np

# Data for three-dimensional scattered points
z = 15 * np.random.random(100)
x = np.sin(z) + 0.1 * np.random.randn(100)
y = np.cos(z) + 0.1 * np.random.randn(100)

fig = go.Figure(data=[go.Mesh3d(x=x, y=y, z=z, color='green',
                                opacity=0.20, alphahull=3)])

fig.show()
Python3
import plotly.graph_objects as go
import numpy as np

# Data for three-dimensional scattered points
z = 15 * np.random.random(100)
x = np.sin(z) + 0.1 * np.random.randn(100)
y = np.cos(z) + 0.1 * np.random.randn(100)

fig = go.Figure(data=[go.Mesh3d(x=x, y=y, z=z, color='green',
                                opacity=0.20, alphahull=3,
                                i=[1, 0, 0, 1],
                                j=[1, 2, 3, 4],
                                k=[4, 3, 1, 3],)])

fig.show()
输出:
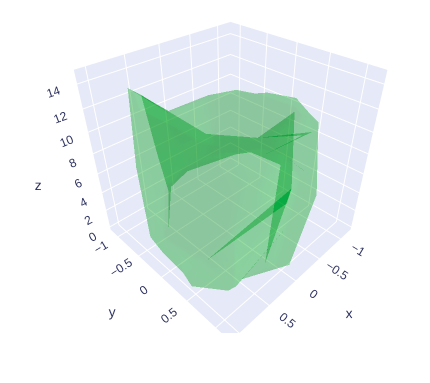
示例 2:具有 Alphahull 参数的 3D 网格示例
在 plotly 中,alphahull 参数用于设置网格图的形状。如果未提供 i、j、k 数组,它确定如何从由 x、y 和 z 数组表示的一组顶点(点)导出网格表面三角形。对于 mesh3d 的一般使用,最好提供 i、j、k。如果为“-1”,则使用 Delaunay 三角剖分,这主要适用于网格是与 delaunayaxis 垂直的单个或多或少层的表面。如果 delaunayaxis 在不止一个点与网格表面相交,则会导致在 delaunayaxis 的维度上非常长的三角形。如果“>0”,则使用阿尔法形状算法。在这种情况下,正的 alphahull 值表示使用了 alpha 形状算法,_并且_它的值作为网格拟合的参数。如果为 0,则使用凸包算法。它适用于凸体,或者如果打算将 x、y 和 z 点设置为凸包。
例子:
蟒蛇3
import plotly.graph_objects as go
import numpy as np

# Data for three-dimensional scattered points
z = 15 * np.random.random(100)
x = np.sin(z) + 0.1 * np.random.randn(100)
y = np.cos(z) + 0.1 * np.random.randn(100)

fig = go.Figure(data=[go.Mesh3d(x=x, y=y, z=z, color='green',
                                opacity=0.20, alphahull=3)])

fig.show()
输出:
显示网格四面体
在网格四面体中,i、j 和 k 参数可用于手动指定网格三角形的几何形状。
例子:
蟒蛇3
import plotly.graph_objects as go
import numpy as np

# Data for three-dimensional scattered points
z = 15 * np.random.random(100)
x = np.sin(z) + 0.1 * np.random.randn(100)
y = np.cos(z) + 0.1 * np.random.randn(100)

fig = go.Figure(data=[go.Mesh3d(x=x, y=y, z=z, color='green',
                                opacity=0.20, alphahull=3,
                                i=[1, 0, 0, 1],
                                j=[1, 2, 3, 4],
                                k=[4, 3, 1, 3],)])

fig.show()
输出:
