在Python使用 Plotly 的等值线图
Plotly 是一个Python库,在数据科学家中非常流行,用于创建交互式数据可视化。 Plotly 中可用的可视化之一是 Choropleth Maps。等值线图用于绘制具有与统计变量成比例的阴影或图案区域的地图。它们由彩色多边形组成。它们用于表示数量的空间变化。
要创建它们,我们需要两种主要类型的输入——
- 几何信息——
- 这可以是一个 GeoJSON 文件(这里每个特征在属性中都有一个id或一些识别值,或者
- 这可以是 plotly 的内置几何图形——美国各州和世界各国
- 以特征标识符作为索引的值列表
Syntax – plotly.express.choropleth((data_frame=None, lat=None, lon=None, locations=None, locationmode=None, geojson=None, color=None, scope=None, center=None, title=None, width=None, height=None)
Parameters:
- lat = this value is used to position marks according to latitude on a map
- long = this value is used to position marks according to longitude on a map
- locations = this value is interpreted according to locationmode and mapped to longitude/latitude.
- locationmode = one of ‘ISO-3’, ‘USA-states’, or ‘country names’. this determines the set of locations used to match entries in locations to regions on the map.
- geojson = contains a Polygon feature collection, with IDs, which are references from locations
- color = used to assign color to marks
- scope = possible values – ‘world’, ‘usa’, ‘europe’, ‘asia’, ‘africa’, ‘north america’, or ‘south america’`Default is `’world’ unless projection is set to ‘albers usa’, which forces ‘usa’
- center = sets the center point of the map
例子:
Python3
# code for creating choropleth map of USA states
# import plotly library
import plotly

# import plotly.express module
# this module is used to create entire figures at once
import plotly.express as px

# create figure
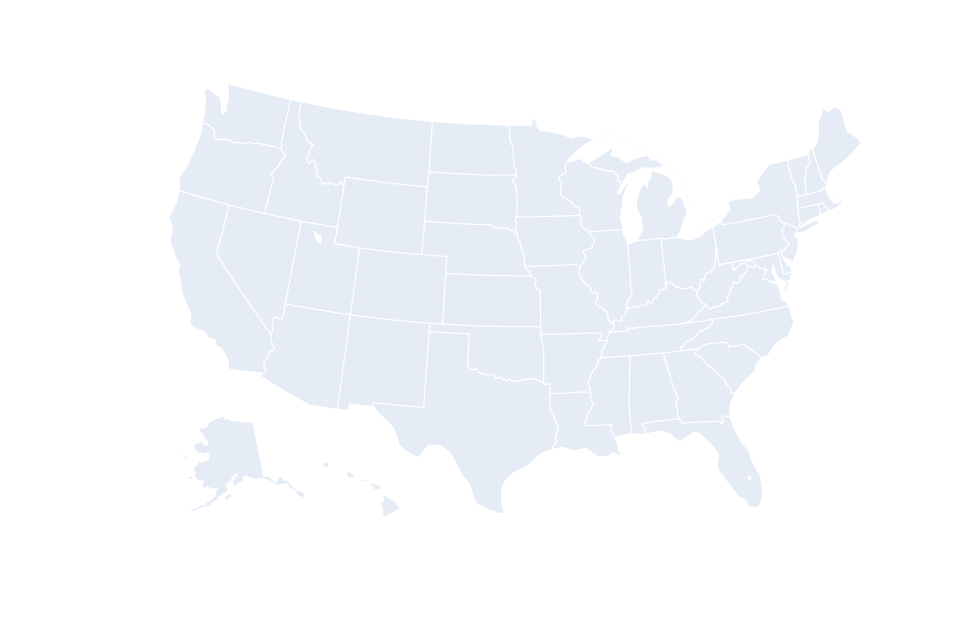
fig = px.choropleth(locationmode="USA-states", color=[1], scope="usa")

fig.show()
Python3
#code for represeting states of USA
#pass list of states in locations
#list will have two-letter abbreviations of states
fig = px.choropleth(locations=["CA","TX","NY"], locationmode="USA-states", color=[1,2,3], scope="usa")

fig.show()
Python3
#import libraries
import pandas as pd
import plotly.express as px

#import data
data = pd.read_csv('2011_us_ag_exports.csv')

# create choropleth map for the data
# color will be the column to be color-coded
# locations is the column with sppatial coordinates
fig = px.choropleth(data, locations='code',
                    locationmode="USA-states", color='total exports', scope="usa")

fig.show()
输出:

区域分布图可用于突出显示或描绘特定区域。下面给出实现这种功能的实现。
例子:
蟒蛇3
#code for represeting states of USA
#pass list of states in locations
#list will have two-letter abbreviations of states
fig = px.choropleth(locations=["CA","TX","NY"], locationmode="USA-states", color=[1,2,3], scope="usa")

fig.show()
输出:

在此示例中,我们将采用美国各州的数据集,并为 2011 年美国的美国农业出口创建区域分布图。
数据集链接– 单击此处
例子:
蟒蛇3
#import libraries
import pandas as pd
import plotly.express as px

#import data
data = pd.read_csv('2011_us_ag_exports.csv')

# create choropleth map for the data
# color will be the column to be color-coded
# locations is the column with sppatial coordinates
fig = px.choropleth(data, locations='code',
                    locationmode="USA-states", color='total exports', scope="usa")

fig.show()
输出:
