R 中的 Plotly 入门
R 编程语言中的Plotly允许从“ggplot2”图形和受图形语法启发的 JavaScript 库“plotly.js”的自定义界面创建交互式 Web 图形。
安装
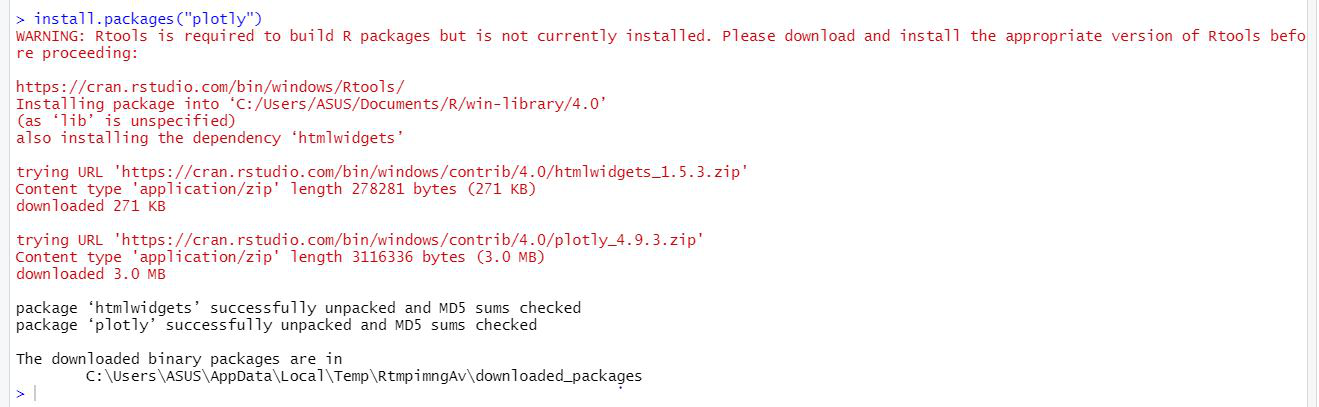
要在 R 编程中使用包,必须先安装包。可以使用命令install.packages(“packagename”)完成此任务。要安装整个plotly包,请键入:
install.packages(“plotly”)
或者通过 devtools 安装最新的开发版本(在 GitHub 上):
devtools::install_github(“ropensci/plotly”)
重要功能
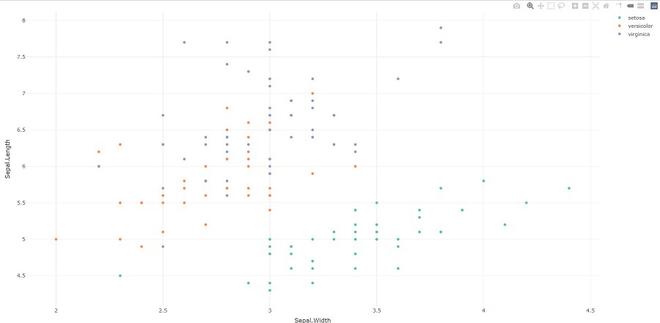
- plot_ly:它基本上启动了一个绘图可视化。此函数将 R 对象映射到 plotly.js,这是一个(MIT 许可的)基于 Web 的交互式图表库。它为做普通事情提供了抽象,并设置了一些不同的默认值,使界面感觉更“R-like”(即,更接近 plot() 和 ggplot2::qplot())。
Syntax:
plot_ly(data = data.frame(), …, type = NULL, name, color, colors = NULL, alpha = NULL, stroke, strokes = NULL, alpha_stroke = 1, size, sizes = c(10, 00), span, spans = c(1, 20), symbol, symbols = NULL, linetype, linetypes = NULL, split, frame, width = NULL, height = NULL, source = “A”)
例子:
R
# import plotly library
library(plotly)

# create plotly visualisation
p <- plot_ly(iris, x = ~Sepal.Width,
                   y = ~Sepal.Length)

# adding markers
add_markers(p, color = ~Petal.Length,
               size = ~Petal.Length)
add_markers(p, color = ~Species)
R
# import plotly library
library(plotly)

# create plotly visualisation
p <- plot_ly(iris, x = ~Sepal.Width,
                    y = ~Sepal.Length)

# structure of plotly using
# plotly_build
str(plotly_bulid(p, registerFrames = TRUE))
R
# import plotly library
library(plotly)

# create plotly visualisation
p <- plot_ly(iris, x = ~Sepal.Width,
                    y = ~Sepal.Length)
layout(p, data = NULL)
R
# import plotly library
library(plotly)

# create plotly visualisation
p <- plot_ly(iris, x = ~Sepal.Width,
                    y = ~Sepal.Length)

# adding trace (lines) to plotly
# visualisation
add_trace(p, type = "scatter",
          mode = "markers+lines")
R
# import plotly library
library(plotly)


plot_ly(mtcars, x = ~wt, y = ~mpg,
        frame = ~cyl) %>%
animation_opts(transition = 0)
R
# import plotly library
library(plotly)


plot_ly() %>% add_data(economics) %>%
        add_trace(x = ~date, y = ~pce)
R
# import plotly library
library(plotly)

# create plotly visualisation
p <- plot_ly(iris, x = ~Sepal.Width,
                    y = ~Sepal.Length)

# importing plotly visualisation
# as image files
Png <- plotly_IMAGE(p,
                    out_file = "plotly-test-image.png")
Jpeg <- plotly_IMAGE(p, format = "jpeg",
                     out_file = "plotly-test-image.jpeg")

# importing plotly visualisation
# as vector graphics
Svg <- plotly_IMAGE(p, format = "svg",
                    out_file = "plotly-test-image.svg")

# importing plotly visualisation as
# pdf file
Pdf <- plotly_IMAGE(p, format = "pdf",
                    out_file = "plotly-test-image.pdf")
R
# import plotly library
library(plotly)
plotly_example(iris)
R
# import plotly library
library(plotly)
plotly_example(type = c("demo", "shiny", "rmd"),
               name, edit = TRUE, ...)
输出:
- plotly_build:这个通用函数创建发送到 plotly.js 以进行渲染的列表对象。使用此函数可用于覆盖默认值或调试渲染错误。
Syntax: plotly_build(p, registerFrames = TRUE)
例子:
电阻
# import plotly library
library(plotly)

# create plotly visualisation
p <- plot_ly(iris, x = ~Sepal.Width,
                    y = ~Sepal.Length)

# structure of plotly using
# plotly_build
str(plotly_bulid(p, registerFrames = TRUE))
输出:
No scatter mode specified:
Setting the mode to markers
Read more about this attribute -> https://plotly.com/r/reference/#scatter-mode
List of 8
$ x :List of 10
..$ visdat :List of 1
.. ..$ 29f4345ac49:function ()
..$ cur_data : chr “29f4345ac49”
..$ attrs :List of 1
.. ..$ 29f4345ac49:List of 5
.. .. ..$ x :Class ‘formula’ language ~Sepal.Width
.. .. .. .. ..- attr(*, “.Environment”)=
.. .. ..$ y :Class ‘formula’ language ~Sepal.Length
.. .. .. .. ..- attr(*, “.Environment”)=
.. .. ..$ alpha_stroke: num 1
.. .. ..$ sizes : num [1:2] 10 100
.. .. ..$ spans : num [1:2] 1 20
……..
- 布局:修改绘图可视化的布局
Syntax: layout(p, …, data = NULL)
例子:
电阻
# import plotly library
library(plotly)

# create plotly visualisation
p <- plot_ly(iris, x = ~Sepal.Width,
                    y = ~Sepal.Length)
layout(p, data = NULL)
输出:

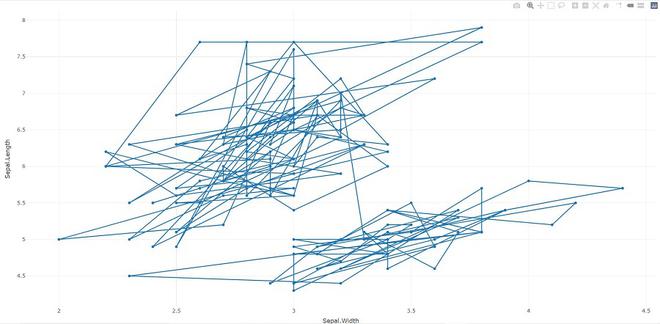
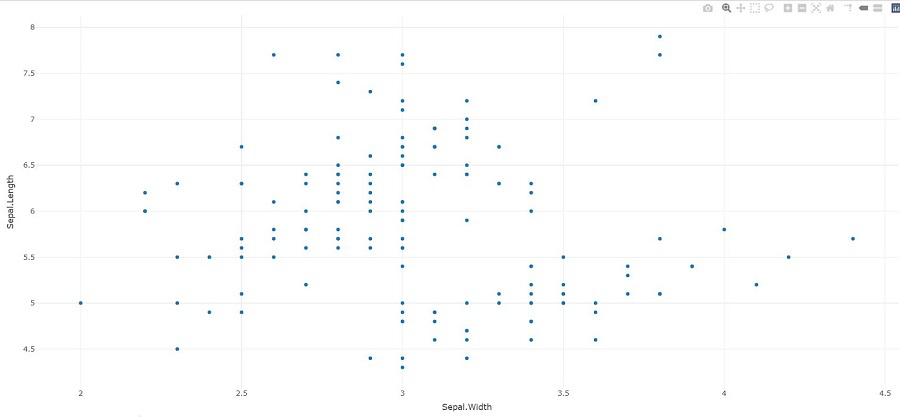
- add_trace:将跟踪添加到绘图可视化中。
Syntax: add_trace(p, …, data = NULL, inherit = TRUE)
例子:
电阻
# import plotly library
library(plotly)

# create plotly visualisation
p <- plot_ly(iris, x = ~Sepal.Width,
                    y = ~Sepal.Length)

# adding trace (lines) to plotly
# visualisation
add_trace(p, type = "scatter",
          mode = "markers+lines")
输出:
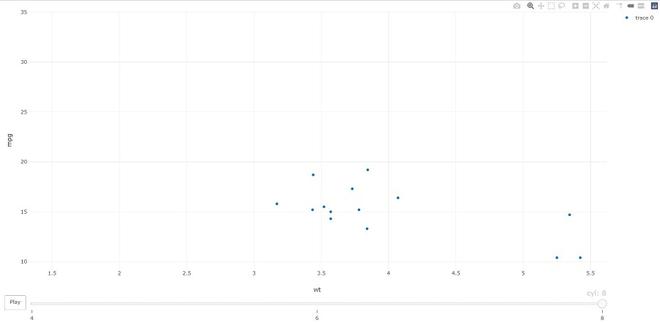
- animation_opts:提供动画配置选项。动画可以通过使用 plot_ly() 中的 frame 参数或 ggplotly() 中的 frame ggplot2 美学来创建。默认情况下,动画会填充播放按钮和滑块组件以控制动画的状态(要暂停动画,请单击滑块栏上的相关位置)。播放按钮和滑块组件都根据 animation_opts() 指定的规则在帧之间转换。
Syntax:
animation_opts(p, frame = 500, transition = frame, easing = “linear”, redraw = TRUE, mode = “immediate”)
animation_slider(p, hide = FALSE, …)
animation_button(p, …, label)
例子:
电阻
# import plotly library
library(plotly)


plot_ly(mtcars, x = ~wt, y = ~mpg,
        frame = ~cyl) %>%
animation_opts(transition = 0)
输出:
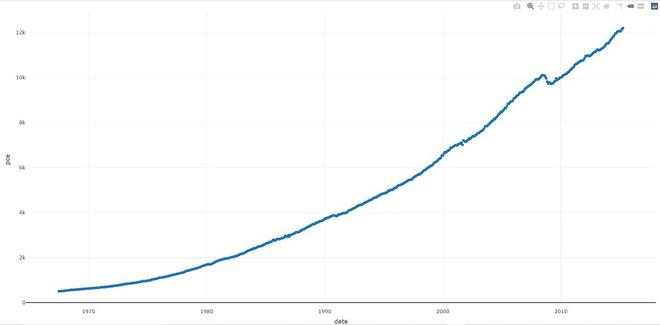
- add_data:将数据添加到绘图可视化。
Syntax: add_data(p, data = NULL)
例子:
电阻
# import plotly library
library(plotly)


plot_ly() %>% add_data(economics) %>%
        add_trace(x = ~date, y = ~pce)
输出:
- plotly_IMAGE:为绘图可视化创建静态图像。图像端点将绘图(可以以多种形式给出)转换为所需格式的图像。
Syntax:
plotly_IMAGE(x, width = 1000, height = 500, format = “png”, scale = 1, out_file, …)
例子:
电阻
# import plotly library
library(plotly)

# create plotly visualisation
p <- plot_ly(iris, x = ~Sepal.Width,
                    y = ~Sepal.Length)

# importing plotly visualisation
# as image files
Png <- plotly_IMAGE(p,
                    out_file = "plotly-test-image.png")
Jpeg <- plotly_IMAGE(p, format = "jpeg",
                     out_file = "plotly-test-image.jpeg")

# importing plotly visualisation
# as vector graphics
Svg <- plotly_IMAGE(p, format = "svg",
                    out_file = "plotly-test-image.svg")

# importing plotly visualisation as
# pdf file
Pdf <- plotly_IMAGE(p, format = "pdf",
                    out_file = "plotly-test-image.pdf")
输出:
- plotly_empty:创建一个完整的空绘图图。当与 subplot() 一起使用时,这是一个非常有用的函数。
Syntax: plotly_empty(…)
例子:
电阻
# import plotly library
library(plotly)
plotly_example(iris)
输出:

- plotly_example:它 运行一个情节示例。提供一个统一的界面,用于运行与软件包捆绑在一起的演示、闪亮的应用程序和 Rmd 文档。
Syntax: plotly_example(type = c(“demo”, “shiny”, “rmd”), name, edit = TRUE, …)
例子:
电阻
# import plotly library
library(plotly)
plotly_example(type = c("demo", "shiny", "rmd"),
               name, edit = TRUE, ...)
输出:

我们可以利用 plotly R 包来创建各种交互式图形。创建绘图对象的两种主要方法:通过将 ggplot2 对象(通过 ggplotly())转换为绘图对象或使用 plot_ly()/plot_geo()/plot_mapbox() 直接初始化绘图对象。这两种方法都有一些互补的优势和劣势,因此学习这两种方法都是值得的。