使用 Matplotlib 在Python中绘制三曲面图
三曲面图是一种曲面图,通过对有限数量的三角形的紧凑曲面进行三角剖分创建,这些三角形以曲面上的每个点都呈三角形的方式覆盖整个曲面。任何两个三角形的相交会导致空洞或公共边或顶点。这种类型的绘图是在均匀采样的网格受到限制且不方便绘图的情况下创建的。通常通过调用 matplotlib 库的 ax.plot_trisurf()函数创建三曲面图。下面列出了该函数的一些属性:Attribute Parameter X, Y, Z dataset as 1D array to be plotted colors color of the surface patches cmap color map to set the color of surface patches norm parameter to normalize map values of colors vmin minimum value of map vamx maximum value of map shade attribute to shade the facecolors
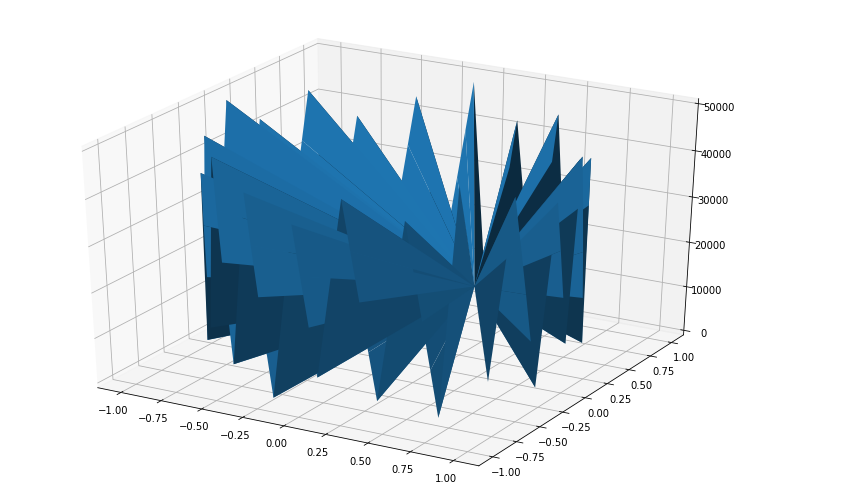
示例 1:让我们使用 ax.plot_trisurf()函数创建一个基本的三曲面图。
Python3
# Import libraries
from mpl_toolkits import mplot3d
import numpy as np
import matplotlib.pyplot as plt


# Creating dataset
z = np.linspace(0, 50000, 100)
x = np.sin(z)
y = np.cos(z)

# Creating figure
fig = plt.figure(figsize =(14, 9))
ax = plt.axes(projection ='3d')

# Creating plot
ax.plot_trisurf(x, y, z,
                linewidth = 0.2,
                antialiased = True);

# show plot
plt.show()
Python3
# Import libraries
from mpl_toolkits.mplot3d import Axes3D
import matplotlib.pyplot as plt
import numpy as np


# Creating radii and angles
r = np.linspace(0.125, 1.0, 100)
a = np.linspace(0, 2 * np.pi,
                100,
                endpoint = False)

# Repeating all angles for every radius
a = np.repeat(a[..., np.newaxis], 100, axis = 1)

# Creating dataset
x = np.append(0, (r * np.cos(a)))
y = np.append(0, (r * np.sin(a)))
z = (np.sin(x ** 4) + np.cos(y ** 4))

# Creating figure
fig = plt.figure(figsize =(16, 9))
ax = plt.axes(projection ='3d')

# Creating color map
my_cmap = plt.get_cmap('hot')

# Creating plot
trisurf = ax.plot_trisurf(x, y, z,
                         cmap = my_cmap,
                         linewidth = 0.2,
                         antialiased = True,
                         edgecolor = 'grey')
fig.colorbar(trisurf, ax = ax, shrink = 0.5, aspect = 5)
ax.set_title('Tri-Surface plot')

# Adding labels
ax.set_xlabel('X-axis', fontweight ='bold')
ax.set_ylabel('Y-axis', fontweight ='bold')
ax.set_zlabel('Z-axis', fontweight ='bold')

# show plot
plt.show()
输出 :
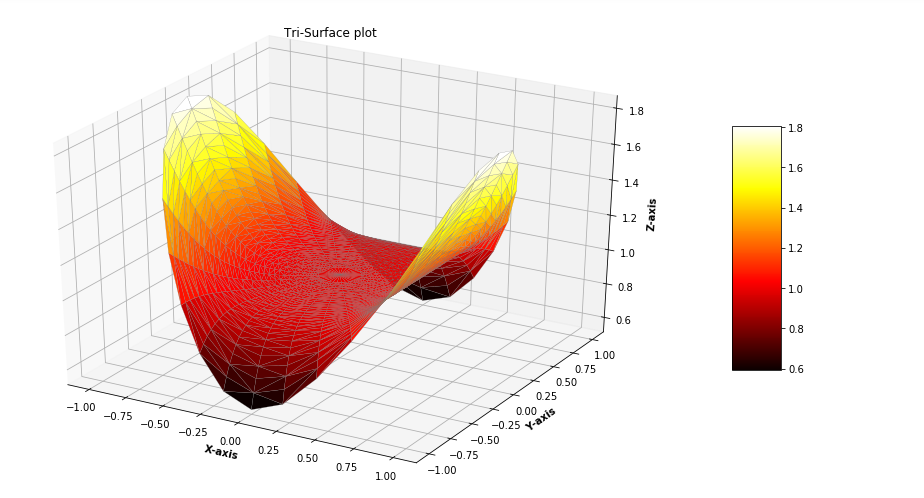
示例 2:为了更好地理解让我们再举一个例子。
Python3
# Import libraries
from mpl_toolkits.mplot3d import Axes3D
import matplotlib.pyplot as plt
import numpy as np


# Creating radii and angles
r = np.linspace(0.125, 1.0, 100)
a = np.linspace(0, 2 * np.pi,
                100,
                endpoint = False)

# Repeating all angles for every radius
a = np.repeat(a[..., np.newaxis], 100, axis = 1)

# Creating dataset
x = np.append(0, (r * np.cos(a)))
y = np.append(0, (r * np.sin(a)))
z = (np.sin(x ** 4) + np.cos(y ** 4))

# Creating figure
fig = plt.figure(figsize =(16, 9))
ax = plt.axes(projection ='3d')

# Creating color map
my_cmap = plt.get_cmap('hot')

# Creating plot
trisurf = ax.plot_trisurf(x, y, z,
                         cmap = my_cmap,
                         linewidth = 0.2,
                         antialiased = True,
                         edgecolor = 'grey')
fig.colorbar(trisurf, ax = ax, shrink = 0.5, aspect = 5)
ax.set_title('Tri-Surface plot')

# Adding labels
ax.set_xlabel('X-axis', fontweight ='bold')
ax.set_ylabel('Y-axis', fontweight ='bold')
ax.set_zlabel('Z-axis', fontweight ='bold')

# show plot
plt.show()
输出: