使用 R 进行简单线性回归的实用方法
简单线性回归是一种统计方法,它使我们能够总结和研究两个连续(定量)变量之间的关系。一个用 x 表示的变量被认为是一个自变量,另一个用 y 表示的变量被认为是一个因变量。假设两个变量是线性相关的。因此,我们试图找到一个线性函数,它尽可能准确地预测响应值 (y) 作为特征或自变量 (x) 的函数。
具有一个因变量和一个自变量的回归方程的最简单形式由以下公式定义:
y = c + b * x
where:
y = estimated dependent variable score,
c = constant, b = regression coefficient, and
x = score on the independent variable.
因变量也称为结果变量、标准变量、内生变量或回归变量。
自变量也称为外生变量、预测变量或回归变量。
回归的总体思路是检查两件事——
- 一组预测变量是否能很好地预测结果(因)变量?
- 特别是哪些变量是结果变量的重要预测因子,它们以什么方式(由 beta 估计值的大小和符号表示)影响结果变量?
这些简单的线性回归估计用于解释一个因变量和一个自变量之间的关系。现在,在这里我们将对我们的一个数据集实施线性回归方法。我们在这里使用的数据集是某个组织的工资数据集,它根据员工在该组织工作的年数来决定其工资。因此,我们需要找出员工工作的年数与他/她获得的薪水之间是否存在任何关系。然后我们将测试我们在训练数据集上建立的模型是否在测试数据集上正常工作。
第1步:
您需要做的第一件事是从这里下载数据集。
将下载的数据集保存在您的系统中,以便在需要时轻松获取。
第2步:
接下来是打开 R 工作室,因为我们将在 R 环境中实现回归。
第 3 步:现在在这一步中,我们将处理将在 R 工作室中执行的整个操作。命令及其简要说明如下 -
加载数据集 -
第一步是设置工作目录。工作目录是指您当前工作的目录。 setwd()用于设置工作目录。
setwd("C:/Users/hp/Desktop")现在我们要将数据集加载到 R 工作室。在本例中,我们有一个 CSV(逗号分隔值)文件,因此我们将使用read.csv()将Salary_Data.csv数据集加载到 R 环境。此外,我们要将数据集分配给一个变量,这里假设我们将变量的名称设为raw_data 。
raw_data <- read.csv("Salary_Data.csv")
现在,要在 R studio 上查看数据集,请使用我们在上一步中加载数据集的变量的名称。
raw_data第 4 步:拆分数据集。
现在我们要将数据集拆分为训练数据集和测试数据集。
Training data, also called AI training data, training set, training dataset, or learning set — is the information used to train an algorithm. The training data includes both input data and the corresponding expected output. Based on this “ground truth” data, the algorithm can learn how to apply technologies such as neural networks, to learn and produce complex results, so that it can make accurate decisions when later presented with new data.
Testing data, on the other hand, includes only input data, not the corresponding expected output. The testing data is used to assess how well your algorithm was trained, and to estimate model properties.
为了进行拆分,我们需要安装caTools package并导入caTools 库。
install.packages('caTools')
library(caTools)
现在,我们将设置种子。当我们将整个数据集拆分为训练数据集和测试数据集时,这个种子将使我们能够在数据集中进行相同的分区。
set.seed(123)现在,在设置种子后,我们将最终拆分数据集。一般情况下,建议按照 3:1 的比例拆分数据集。也就是说,原始数据集的 75% 将是我们的训练数据集,原始数据集的 25% 将是我们的测试数据集。但是,在这个数据集中,我们只有 30 行。因此,更合适的是允许 20 行(即 2/3 部分)到训练数据集和 10 行(即 1/3 部分)到测试数据集。
split = sample.split(raw_data$Salary, SplitRatio = 2/3)这里的sample.split()是分割原始数据集的函数。该函数的第一个参数表示我们要根据哪一列拆分数据集。在这里,我们在 Salary 列的基础上进行了拆分。 SplitRatio指定将分配给训练数据集的部分。
现在, split = TRUE的子集将分配给训练数据集,而split = FALSE的子集将分配给测试数据集。
训练集
第 5 步:将线性简单回归拟合到训练数据集。
现在,我们将制作一个适合我们训练数据集的线性回归模型。 lm()函数用于这样做。 lm()用于拟合线性模型。可用于进行回归、单层方差分析和协方差分析。
regressor = lm(formula = Salary ~ YearsExperience, data = training_set)基本上, lm()函数有许多参数,但在这里我们不会使用所有参数。第一个参数指定我们要用于设置线性模型的公式。她,我们使用多年的经验作为自变量来预测因变量,即工资。第二个参数指定我们想要将哪个数据集提供给回归器来构建我们的模型。我们将使用训练数据集来馈送回归器。
在训练数据集上训练我们的模型后,是时候分析我们的模型了。为此,请在 R 控制台中编写以下命令:
summary(regressor)
第 6 步:预测最佳集合结果
现在,是时候根据我们在训练数据集上建立的模型来预测测试集结果了。 predict()函数用于执行此操作。我们在函数传递的第一个参数是模型。在这里,模型是回归器。第二个参数是newdata ,它指定我们想要在哪个数据集上实现我们的训练模型并预测新数据集的结果。在这里,我们采用了要在其上实现模型的test_set 。
y_pred = predict(regressor, newdata = test_set)
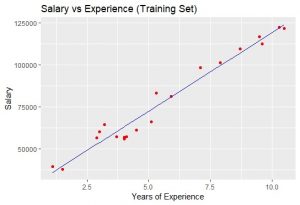
第 7 步:可视化训练集结果
我们将可视化训练集结果。为此,我们将使用ggplot2库。 ggplot2是一个基于图形语法的声明式创建图形的系统。您提供数据,告诉ggplot2如何将变量映射到美学,使用哪些图形原语,并处理细节。
library(ggplot2)

ggplot() +
  geom_point(aes(x = training_set$YearsExperience,
                 y = training_set$Salary), colour = 'red') +
  geom_line(aes(x = training_set$YearsExperience,
                y = predict(regressor, newdata = training_set)),
               colour = 'blue') +
  ggtitle('Salary vs Experience (Training Set)') +
           xlab('Years of Experience') +
           ylab('Salary')
输出: 
图中的蓝色直线代表我们从训练数据集得出的回归量。由于我们正在使用简单的线性回归,因此,获得了直线。此外,红色点代表实际的训练数据集。
虽然,我们没有准确预测结果,但我们训练的模型已经足够接近达到准确度。步骤 #8:可视化测试集结果
正如我们为可视化训练数据集所做的那样,类似地,我们也可以将测试数据集可视化。
library(ggplot2)
ggplot() +
  geom_point(aes(x = test_set$YearsExperience,
                 y = test_set$Salary),
                colour = 'red') +
  geom_line(aes(x = training_set$YearsExperience,
                y = predict(regressor, newdata = training_set)),
                colour = 'blue') +
  ggtitle('Salary vs Experience (Test Set)') +
  xlab('Years of Experience') +
  ylab('Salary')
输出:  让我们看看 R 和Python的完整代码 -
R
# Simple Linear Regression

# Importing the dataset
dataset = read.csv('Salary_Data.csv')

# Splitting the dataset into the Training set and Test set
install.packages('caTools')
library(caTools)
set.seed(123)

split = sample.split(dataset$Salary, SplitRatio = 2/3)
training_set = subset(dataset, split == TRUE)
test_set = subset(dataset, split == FALSE)

# Fitting Simple Linear Regression to the Training set
regressor = lm(formula = Salary ~ YearsExperience,
data = training_set)

# Predicting the Test set results
y_pred = predict(regressor, newdata = test_set)

# Visualising the Training set results
library(ggplot2)
ggplot() +
geom_point(aes(x = training_set$YearsExperience,
              y = training_set$Salary),
              colour = 'red') +
geom_line(aes(x = training_set$YearsExperience,
              y = predict(regressor, newdata = training_set)),
              colour = 'blue') +
ggtitle('Salary vs Experience (Training set)') +
xlab('Years of experience') +
ylab('Salary')

# Visualising the Test set results
library(ggplot2)
ggplot() +
geom_point(aes(x = test_set$YearsExperience, y = test_set$Salary),
colour = 'red') +
geom_line(aes(x = training_set$YearsExperience,
              y = predict(regressor, newdata = training_set)),
colour = 'blue') +
ggtitle('Salary vs Experience (Test set)') +
xlab('Years of experience') +
ylab('Salary')
Python
# Simple Linear Regression

# Importing the libraries
import numpy as np
import matplotlib.pyplot as plt
import pandas as pd

# Importing the dataset
dataset = pd.read_csv('Salary_Data.csv')
X = dataset.iloc[:, :-1].values
y = dataset.iloc[:, 1].values

# Splitting the dataset into the Training set and Test set
from sklearn.cross_validation import train_test_split
X_train, X_test, y_train, y_test = train_test_split(
            X, y, test_size = 1/3, random_state = 0)

# Fitting Simple Linear Regression to the Training set
from sklearn.linear_model import LinearRegression
regressor = LinearRegression()
regressor.fit(X_train, y_train)

# Predicting the Test set results
y_pred = regressor.predict(X_test)

# Visualising the Training set results
plt.scatter(X_train, y_train, color = 'red')
plt.plot(X_train, regressor.predict(X_train), color = 'blue')
plt.title('Salary vs Experience (Training set)')
plt.xlabel('Years of Experience')
plt.ylabel('Salary')
plt.show()

# Visualising the Test set results
plt.scatter(X_test, y_test, color = 'red')
plt.plot(X_train, regressor.predict(X_train), color = 'blue')
plt.title('Salary vs Experience (Test set)')
plt.xlabel('Years of Experience')
plt.ylabel('Salary')
plt.show()