使用 Matplotlib 在Python中的两条曲线之间制作填充多边形
Matplotlib是Python中用于数组二维图的惊人可视化库。 Matplotlib 是一个基于 NumPy 数组构建的多平台数据可视化库,旨在与更广泛的 SciPy 堆栈配合使用。
要在两条曲线之间创建填充多边形,需要在 y1 和 y2 之间创建 PolyCollection 填充。
上述任务的参数:
- x:它是一个长度为 N 的数组,其中包含 x 的数据。
- y1:它是一个长度为 N 的数组或标量,其中包含 y 的数据。
- y2:它是一个长度为 N 的数组或标量,其中包含 y 的数据。
例子:
Python3
import matplotlib.pyplot as plt
import numpy as np
# set the width
width = 3.5
# set the height
height = 2.5
# set the depth
depth = 65
# plot the figure
plt.figure(figsize =(width, height), dpi = depth)
# set the x array of length 3
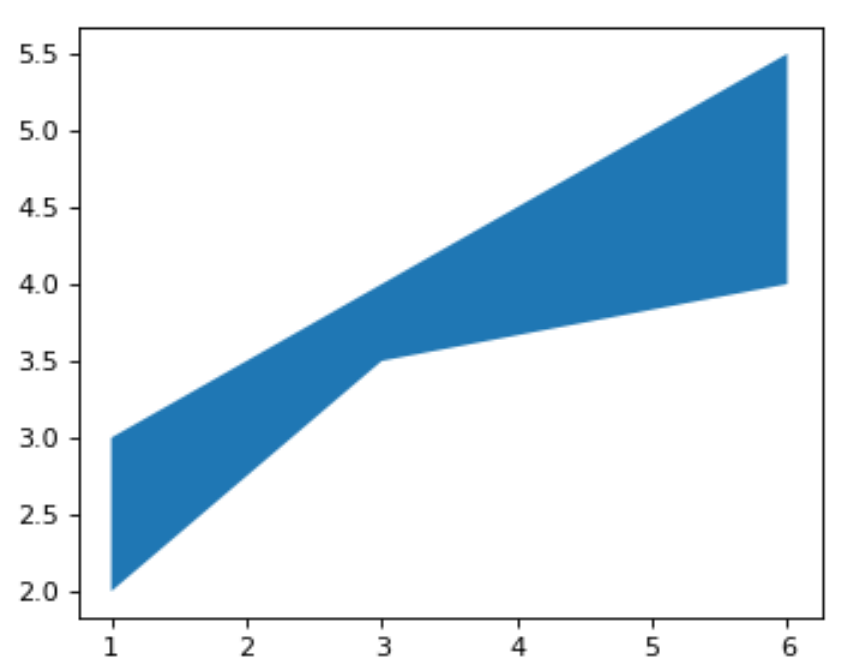
x = [1, 3, 6]
# set y1 array of length 3
y1 = [2, 3.5, 4]
# set y2 array of length 3
y2 = [3, 4, 5.5]
# fill the horizontal area between y1 and y2
plt.fill_between(x, y1, y2)
# show the plotted figure
plt.show()输出: