在 Pandas 的 Groupby 对象中绘制每个组的大小
Pandas dataframe.groupby()函数是库中最有用的函数之一,它根据列/条件将数据分成组,然后应用一些操作,例如。 size() 计算每组中的条目/行数。 groupby() 也可以应用于系列。
Syntax: DataFrame.groupby(by=None, axis=0, level=None, as_index=True, sort=True, group_keys=True, squeeze=False, **kwargs)
Parameters :
by : mapping, function, str, or iterable
axis : int, default 0
level : If the axis is a MultiIndex (hierarchical), group by a particular level or levels
as_index : For aggregated output, return object with group labels as the index. Only relevant for DataFrame input. as_index=False is effectively “SQL-style” grouped output
sort : Sort group keys. Get better performance by turning this off. Note this does not influence the order of observations within each group. groupby preserves the order of rows within each group.
group_keys : When calling apply, add group keys to index to identify pieces
squeeze : Reduce the dimensionality of the return type if possible, otherwise return a consistent type
Returns : GroupBy object
在下面的示例中,我们将使用seaborn和pandas两个库,其中 seaborn 用于绘图,pandas 用于读取数据。我们将使用 seaborn 的 load_dataset() 方法来加载 penguins.csv 数据集。
Python3
# import the module
import seaborn as sns
dataset = sns.load_dataset('penguins')

# displaying the data
print(dataset.head())
Python3
# display the number of columns and their data types
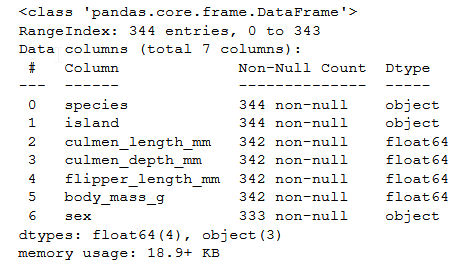
dataset.info()
Python3
# apply groupby on the island column
# plotting
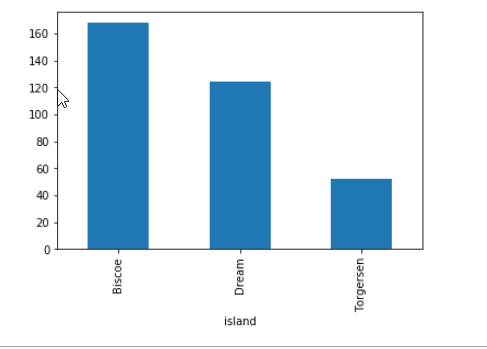
dataset.groupby(['island']).size().plot(kind = "bar")
Python3
# use the groupby() function to group island column
# and apply size() function
# size() is equivalent to counting the distinct rows
result = dataset.groupby(['island']).size()

# plot the result
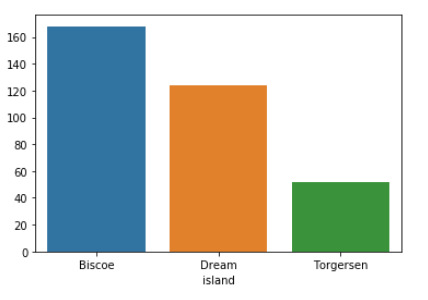
sns.barplot(x = result.index, y = result.values)
输出 :

数据集的前五行
有关使用info()方法的数据集的更多信息
Python3
# display the number of columns and their data types
dataset.info()
输出 :

有关数据集的信息
我们将使用groupby()方法根据“岛”对数据进行分组并绘制它。
使用 Pandas 绘图:
Python3
# apply groupby on the island column
# plotting
dataset.groupby(['island']).size().plot(kind = "bar")

使用 Pandas 绘制 groupby() 大小的图
使用 Seaborn 绘图
Python3
# use the groupby() function to group island column
# and apply size() function
# size() is equivalent to counting the distinct rows
result = dataset.groupby(['island']).size()

# plot the result
sns.barplot(x = result.index, y = result.values)

大小图使用
海博恩