在Python中使用 Plotly 注释热图
Plotly 是一个Python库,用于设计图形,尤其是交互式图形。它可以绘制各种图形和图表,如直方图、条形图、箱线图、散布图等等。它主要用于数据分析和财务分析。 plotly 是一个交互式可视化库。
带注释的热图
带注释的热图是热图最重要的组成部分,因为它们显示了与热图中的行或列相关的附加信息。注释热图将表示为网格行,通过这些网格可以将多个指标与其他指标进行比较。
Syntax: create_annotated_heatmap(z, x=None, y=None, annotation_text=None, colorscale=’Plasma’, font_colors=None, showscale=False, reversescale=False)
Parameters:
x: x axis labels.
y: y axis labels.
z: z matrix to create heatmap.
annotation_text: Text strings for annotations. Should have the same dimensions as the z matrix. If no text is added, the values of the z matrix are annotated. Default = z matrix values.
colorscale: heatmap colorscale.
例子:
Python3
import plotly.figure_factory as ff
import numpy as np

feature_x = np.arange(0, 10, 2)
feature_y = np.arange(0, 10, 3)

# Creating 2-D grid of features
[X, Y] = np.meshgrid(feature_x, feature_y)

Z = np.cos(X / 2) + np.sin(Y / 4)

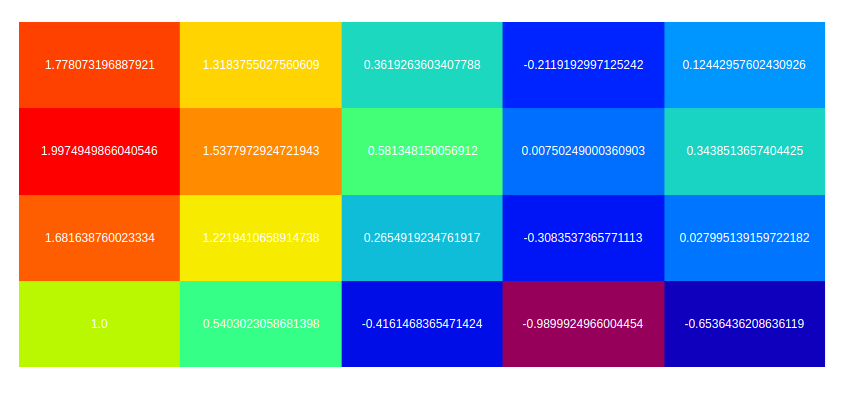
fig = ff.create_annotated_heatmap(Z)
fig.show()
Python3
import plotly.figure_factory as ff
import numpy as np

feature_x = np.arange(0, 10, 2)
feature_y = np.arange(0, 10, 3)

# Creating 2-D grid of features
[X, Y] = np.meshgrid(feature_x, feature_y)

Z = np.cos(X / 2) + np.sin(Y / 4)

fig = ff.create_annotated_heatmap(Z, colorscale='rainbow')
fig.show()
Python3
import plotly.figure_factory as ff
import numpy as np

feature_x = np.arange(0, 10, 2)
feature_y = np.arange(0, 10, 3)

# Creating 2-D grid of features
[X, Y] = np.meshgrid(feature_x, feature_y)

Z = np.cos(X / 2) + np.sin(Y / 4)

custom = [[0, 'green'], [0.5, 'red']]

fig = ff.create_annotated_heatmap(Z, colorscale=custom)
fig.show()
输出:

定义色阶
在 plotly 中,色阶或颜色图表是具有不同颜色类型的平面物理对象。可以使用colorscale参数在此图中设置它。
示例 1:
Python3
import plotly.figure_factory as ff
import numpy as np

feature_x = np.arange(0, 10, 2)
feature_y = np.arange(0, 10, 3)

# Creating 2-D grid of features
[X, Y] = np.meshgrid(feature_x, feature_y)

Z = np.cos(X / 2) + np.sin(Y / 4)

fig = ff.create_annotated_heatmap(Z, colorscale='rainbow')
fig.show()
输出:

示例 2:添加自定义色阶
Python3
import plotly.figure_factory as ff
import numpy as np

feature_x = np.arange(0, 10, 2)
feature_y = np.arange(0, 10, 3)

# Creating 2-D grid of features
[X, Y] = np.meshgrid(feature_x, feature_y)

Z = np.cos(X / 2) + np.sin(Y / 4)

custom = [[0, 'green'], [0.5, 'red']]

fig = ff.create_annotated_heatmap(Z, colorscale=custom)
fig.show()
输出:
