在 Plotly 中使用 graph_objects 类创建热图
Plotly 是一个Python库,用于设计图形,尤其是交互式图形。它可以绘制各种图形和图表,如直方图、条形图、箱线图、散布图等等。它主要用于数据分析和财务分析。 plotly 是一个交互式可视化库。
使用 graph_objects 的热图
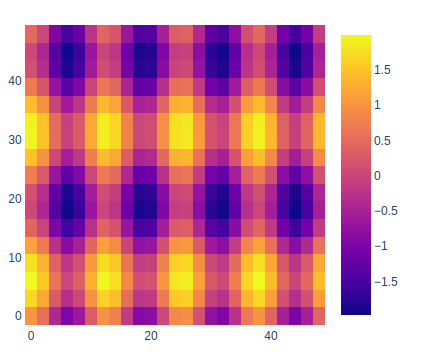
热图是数据的二维图形表示,其中包含在矩阵中的各个值表示为颜色。
Syntax: plotly.graph_objects.Heatmap(arg=None, autocolorscale=None, colorbar=None, colorscale=None, x=None, y=None, z=None, **kwargs)
Parameters:
arg: dict of properties compatible with this constructor
autocolorscale: Determines whether the colorscale is a default palette (autocolorscale: true) or the palette determined by colorscale.
colorbar: plotly.graph_objects.heatmap.ColorBar instance or dict with compatible properties
colorscale: Sets the colorscale. The colorscale must be an array containing arrays mapping a normalized value to an rgb, rgba, hex, hsl, hsv, or named color string.
x: Sets the x coordinates.
y: Sets the y coordinates.
z: Sets the z coordinates.
例子:
Python3
import plotly.graph_objects as go

feature_x = np.arange(0, 50, 2)
feature_y = np.arange(0, 50, 3)

# Creating 2-D grid of features
[X, Y] = np.meshgrid(feature_x, feature_y)

Z = np.cos(X / 2) + np.sin(Y / 4)

fig = go.Figure(data =
     go.Heatmap(x = feature_x, y = feature_y, z = Z,))

fig.show()
Python3
import plotly.graph_objects as go

feature_x = np.arange(0, 50, 2)
feature_y = np.arange(0, 50, 3)

# Creating 2-D grid of features
[X, Y] = np.meshgrid(feature_x, feature_y)

Z = np.cos(X / 2) + np.sin(Y / 4)

fig = go.Figure(data=go.Heatmap(
  x=feature_x, y=feature_y, z=Z,))

fig.update_layout(
    margin=dict(t=200, r=200, b=200, l=200),
    showlegend=False,
    width=700, height=700,
    autosize=False)


fig.show()
输出:

呈现块大小不等的热图
在绘图中,可以显示块的大小不等,以使数据彼此区分开来,以便在呈现时更加清晰,因为数据彼此相比具有不同的高度和宽度。
例子:
Python3
import plotly.graph_objects as go

feature_x = np.arange(0, 50, 2)
feature_y = np.arange(0, 50, 3)

# Creating 2-D grid of features
[X, Y] = np.meshgrid(feature_x, feature_y)

Z = np.cos(X / 2) + np.sin(Y / 4)

fig = go.Figure(data=go.Heatmap(
  x=feature_x, y=feature_y, z=Z,))

fig.update_layout(
    margin=dict(t=200, r=200, b=200, l=200),
    showlegend=False,
    width=700, height=700,
    autosize=False)


fig.show()
输出:
