将 Pandas 交叉表转换为 Stacked DataFrame
在本文中,我们将讨论如何将 pandas 交叉表转换为堆叠数据框。
堆叠 DataFrame 是一种多级索引,与原始 DataFrame 相比具有一个或多个新的内部级别。如果列具有单个级别,则结果是一个系列对象。
panda 的交叉表函数是一个频率表,它通过构建一个交叉表来计算某些数据组之间的频率,从而显示两个或多个变量之间的关系。
句法:
pandas.crosstab(index, columns, rownames=None, colnames=None)
参数:
- index –数组或系列或类似数组的对象的列表。此值用于按行分组
- columns -数组或系列或类似数组的对象列表。此值用于在列中分组
- rownames –此处指定的名称必须与传递的行数组的数量相匹配。
- colnames –此处指定的名称必须与传递的列数组的数量相匹配。
例子:
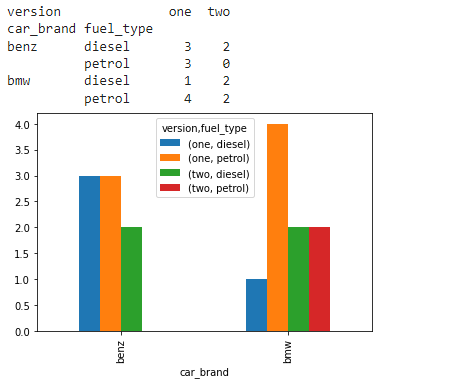
在此示例中,我们创建了 3 个示例数组,即 car_brand、version、fuel_type,如图所示。现在,我们将这些数组作为索引、列以及行和列名称传递给交叉表函数,如图所示。
最后,交叉表数据框也可以使用Python plot.bar()函数进行可视化
Python3
# import the numpy and pandas package
import numpy as np
import pandas as pd

# create three separate arrays namely car_brand,
# version, fuel_type as shown
car_brand = np.array(["bmw", "bmw", "bmw", "bmw", "benz", "benz",
                      "bmw", "bmw", "benz", "benz", "benz", "benz",
                      "bmw", "bmw", "bmw", "benz", "benz", ],
                     dtype=object)

version = np.array(["one", "one", "one", "two", "one", "one", "one",
                    "two", "one", "one", "one", "two", "two", "two",
                    "one", "two", "one"], dtype=object)

fuel_type = np.array(["petrol", "petrol", "petrol", "diesel", "diesel",
                      "petrol", "diesel", "diesel", "diesel", "petrol",
                      "petrol", "diesel", "petrol", "petrol", "petrol",
                      "diesel", "diesel", ],
                     dtype=object)

# use pandas crosstab and pass the three arrays
# as index and columns to create a crosstab table.
cross_tab_data = pd.crosstab(index=car_brand,
                             columns=[version, fuel_type],
                             rownames=['car_brand'],
                             colnames=['version', 'fuel_type'])

print(cross_tab_data)

barplot = cross_tab_data.plot.bar()
Python3
# import the numpy and pandas package
import numpy as np
import pandas as pd

# create three separate arrays namely car_brand,
# version, fuel_type as shown
car_brand = np.array(["bmw", "bmw", "bmw", "bmw", "benz", "benz",
                      "bmw", "bmw", "benz", "benz", "benz", "benz",
                      "bmw", "bmw", "bmw", "benz", "benz", ],
                     dtype=object)

version = np.array(["one", "one", "one", "two", "one", "one", "one",
                    "two", "one", "one", "one", "two", "two", "two",
                    "one", "two", "one"], dtype=object)

fuel_type = np.array(["petrol", "petrol", "petrol", "diesel", "diesel",
                      "petrol", "diesel", "diesel", "diesel", "petrol",
                      "petrol", "diesel", "petrol", "petrol", "petrol",
                      "diesel", "diesel", ],
                     dtype=object)

# use pandas crosstab and pass the three
# arrays as index and columns
# to create a crosstab table.
cross_tab_data = pd.crosstab(index=car_brand,
                             columns=[version, fuel_type],
                             rownames=['car_brand'],
                             colnames=['version', 'fuel_type'])

barplot = cross_tab_data.plot.bar()

# use the created sample crosstab data
# to convert it to a stacked dataframe
stacked_data = cross_tab_data.stack(level=1)

print(stacked_data)
Python3
# import the numpy and pandas package
import numpy as np
import pandas as pd

# create three separate arrays namely car_brand,
# version, fuel_type as shown
car_brand = np.array(["bmw", "bmw", "bmw", "bmw", "benz",
                      "benz", "bmw", "bmw", "benz", "benz",
                      "benz", "benz", "bmw", "bmw", "bmw",
                      "benz", "benz", ], dtype=object)

version = np.array(["one", "one", "one", "two", "one", "one",
                    "one", "two", "one", "one", "one", "two",
                    "two", "two", "one", "two", "one"],
                   dtype=object)

fuel_type = np.array(["petrol", "petrol", "petrol", "diesel",
                      "diesel", "petrol", "diesel", "diesel",
                      "diesel", "petrol", "petrol", "diesel",
                      "petrol", "petrol", "petrol", "diesel",
                      "diesel", ], dtype=object)

year_release = np.array([2000, 2005, 2000, 2007, 2000, 2005,
                         2007, 2005, 2005, 2000, 2007, 2000,
                         2007, 2005, 2005, 2007, 2000],
                        dtype=object)

# use pandas crosstab and pass the three arrays
# as index and columns to create a crosstab table.
cross_tab_data = pd.crosstab(index=car_brand,
                             columns=[version, fuel_type, year_release],
                             rownames=['car_brand'],
                             colnames=['version', 'fuel_type', 'year_release'])

barplot = cross_tab_data.plot.bar()

# use the created sample crosstab data to
# convert it to a stacked dataframe with
# level 1
stacked_data = cross_tab_data.stack(level=1)


barplot = stacked_data.plot.bar()

# use the created sample crosstab data to
# convert it to a stacked dataframe with
# level 2
stacked_data = cross_tab_data.stack(level=2)

barplot = stacked_data.plot.bar()
输出:
将交叉表转换为堆叠数据框:
在这里,我们将指定要堆叠的级别数。这将根据 pandas DataFrame 特定列的轴级别进行转换。
句法:
pandas.DataFrame.stack(level, dropna)参数:
- level -指定要在结果数据框中从列轴堆叠到索引轴的级别
- dropna –布尔类型。是否删除结果 DataFrame/Series 中缺少值的行
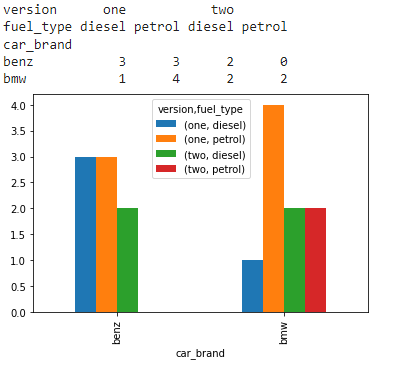
示例 1:
在这里,我们将交叉表转换为堆叠数据框。 Fuel_type 级别将作为一列堆叠在结果数据框中。
Python3
# import the numpy and pandas package
import numpy as np
import pandas as pd

# create three separate arrays namely car_brand,
# version, fuel_type as shown
car_brand = np.array(["bmw", "bmw", "bmw", "bmw", "benz", "benz",
                      "bmw", "bmw", "benz", "benz", "benz", "benz",
                      "bmw", "bmw", "bmw", "benz", "benz", ],
                     dtype=object)

version = np.array(["one", "one", "one", "two", "one", "one", "one",
                    "two", "one", "one", "one", "two", "two", "two",
                    "one", "two", "one"], dtype=object)

fuel_type = np.array(["petrol", "petrol", "petrol", "diesel", "diesel",
                      "petrol", "diesel", "diesel", "diesel", "petrol",
                      "petrol", "diesel", "petrol", "petrol", "petrol",
                      "diesel", "diesel", ],
                     dtype=object)

# use pandas crosstab and pass the three
# arrays as index and columns
# to create a crosstab table.
cross_tab_data = pd.crosstab(index=car_brand,
                             columns=[version, fuel_type],
                             rownames=['car_brand'],
                             colnames=['version', 'fuel_type'])

barplot = cross_tab_data.plot.bar()

# use the created sample crosstab data
# to convert it to a stacked dataframe
stacked_data = cross_tab_data.stack(level=1)

print(stacked_data)
输出:
示例 2 :
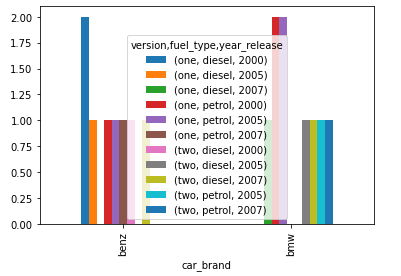
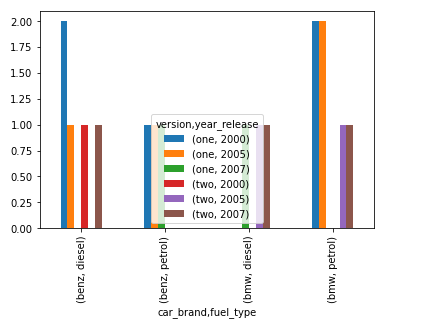
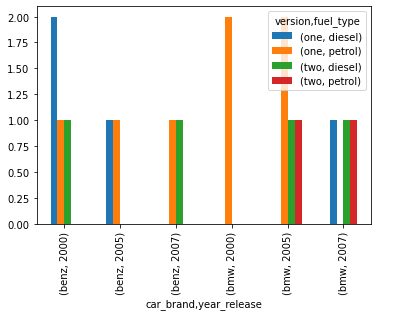
在此示例中,我们展示了两个级别 1 和 2 的结果。
Python3
# import the numpy and pandas package
import numpy as np
import pandas as pd

# create three separate arrays namely car_brand,
# version, fuel_type as shown
car_brand = np.array(["bmw", "bmw", "bmw", "bmw", "benz",
                      "benz", "bmw", "bmw", "benz", "benz",
                      "benz", "benz", "bmw", "bmw", "bmw",
                      "benz", "benz", ], dtype=object)

version = np.array(["one", "one", "one", "two", "one", "one",
                    "one", "two", "one", "one", "one", "two",
                    "two", "two", "one", "two", "one"],
                   dtype=object)

fuel_type = np.array(["petrol", "petrol", "petrol", "diesel",
                      "diesel", "petrol", "diesel", "diesel",
                      "diesel", "petrol", "petrol", "diesel",
                      "petrol", "petrol", "petrol", "diesel",
                      "diesel", ], dtype=object)

year_release = np.array([2000, 2005, 2000, 2007, 2000, 2005,
                         2007, 2005, 2005, 2000, 2007, 2000,
                         2007, 2005, 2005, 2007, 2000],
                        dtype=object)

# use pandas crosstab and pass the three arrays
# as index and columns to create a crosstab table.
cross_tab_data = pd.crosstab(index=car_brand,
                             columns=[version, fuel_type, year_release],
                             rownames=['car_brand'],
                             colnames=['version', 'fuel_type', 'year_release'])

barplot = cross_tab_data.plot.bar()

# use the created sample crosstab data to
# convert it to a stacked dataframe with
# level 1
stacked_data = cross_tab_data.stack(level=1)


barplot = stacked_data.plot.bar()

# use the created sample crosstab data to
# convert it to a stacked dataframe with
# level 2
stacked_data = cross_tab_data.stack(level=2)

barplot = stacked_data.plot.bar()
输出: