在 R 中设置 ggplot2 图的图例 Alpha
在本文中,我们将看到如何在 R 编程语言中设置 ggplot2 图的图例 alpha。
使用 ggplot2 包中的 guide_legend函数的 alpha 参数设置图的图例 alpha。
Syntax: guide_legend(override.aes = list(alpha))
Parameters:
- override.aes: allows the user to change only the legend appearance without affecting the rest of the plot.
笔记:
- 图例图例的 alpha 值用于设置图例符号的透明度索引,换句话说,alpha 值越接近于 0 将使图例透明,而越接近于值 1 则使图例符号不透明。
- Alpha 值是从 0(透明)到 1(不透明)的任何数字。默认的 alpha 值通常是 1。
- 可以将 alpha 设置为常量值,也可以通过比例映射。
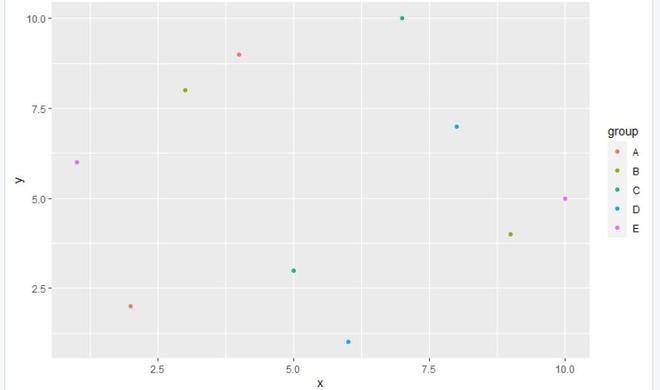
没有在 ggplot2 中设置 Legend alpha
在此示例中,我们将使用 R 编程语言中 ggplot2 包的 guide_legend函数的 alpha 参数将 ggplot2 图的图例的 alpha 值设置为一个值。
R
library("ggplot2")

gfg<-data.frame(x =c(4,9,5,6,10,2,3,7,8,1),
                y = c(9,4,3,1,5,2,8,10,7,6),
                group = c('A','B','C','D','E'))
gfg_plot <- ggplot(gfg, aes(x, y, col = group)) + geom_point()
gfg_plot
R
library("ggplot2")

gfg<-data.frame(x =c(4,9,5,6,10,2,3,7,8,1),
                y = c(9,4,3,1,5,2,8,10,7,6) ,
                group = c('A','B','C','D','E'))

gfg_plot <- ggplot(gfg, aes(x, y, col = group)) + geom_point()
gfg_plot+guides(colour = guide_legend
                (override.aes = list(alpha = 0.5)))
R
library("ggplot2")

gfg<-data.frame(x = c(4,9,5,6,10,2,3,7,8,1),
                y = c(9,4,3,1,5,2,8,10,7,6),
                group = c('A','B','C','D','E'))
gfg_plot <- ggplot(gfg, aes(x, y, col = group)) + geom_point()
gfg_plot+guides(colour = guide_legend
                (override.aes = list(alpha = 0.1)))
输出:

在 ggplot2 中使用 Alpha
在这里,我们将设置图例 alpha 值。
示例 1:在本示例中,我们将使用 0.5 的 alpha 值,这将设置图例的不透明。
电阻
library("ggplot2")

gfg<-data.frame(x =c(4,9,5,6,10,2,3,7,8,1),
                y = c(9,4,3,1,5,2,8,10,7,6) ,
                group = c('A','B','C','D','E'))

gfg_plot <- ggplot(gfg, aes(x, y, col = group)) + geom_point()
gfg_plot+guides(colour = guide_legend
                (override.aes = list(alpha = 0.5)))
输出:

示例 2:在此示例中,我们将使用 R 编程语言中 ggplot2 包的 guide_legend函数的 alpha 参数将 ggplot2 图的图例的 alpha 值设置为等于 0.1 的值。
电阻
library("ggplot2")

gfg<-data.frame(x = c(4,9,5,6,10,2,3,7,8,1),
                y = c(9,4,3,1,5,2,8,10,7,6),
                group = c('A','B','C','D','E'))
gfg_plot <- ggplot(gfg, aes(x, y, col = group)) + geom_point()
gfg_plot+guides(colour = guide_legend
                (override.aes = list(alpha = 0.1)))
输出:
