在 R 中使用 ggplot2 包绘制多个叠加直方图
在本文中,我们将看到如何使用 R 编程语言中的 ggplot2 包绘制多个叠加的直方图。
我们将使用来自 ggplot2 包的geom_histogram()函数的 alpha 参数绘制多个重叠的直方图。在这种绘制多个叠加直方图的方法中,用户首先需要在 R 控制台上安装并导入 ggplot2 包,并调用geaom_histogram函数,并将该函数的 alpha 参数指定为 0 到 1 之间的浮点值,这将导致将数据框集作为此函数参数在同一图上绘制不同直方图的透明度,以获得 R 编程语言中的多个重叠直方图。
geom_histogram()函数:该函数是 ggplot2 模块的内置函数。
Syntax: geom_histogram(mapping = NULL, data = NULL, stat = “bin”, position = “stack”, …)
Parameters:
- mapping: The aesthetic mapping, usually constructed with aes or aes_string. Only needs to be set at the layer level if you are overriding the plot defaults.
- data: A layer-specific dataset – only needed if you want to override the plot defaults.
- stat: The statistical transformation to use on the data for this layer.
- position: The position adjustment to use for overlapping points on this layer
要在 R 控制台中安装和导入 ggplot2 包,用户需要遵循以下语法:
install.packages("ggplot2")
library("ggplot2")
alpha 参数:这是一个图形参数,是一个从 0 到 1 不透明到透明的数字,它调整绘图的透明度。
示例 1:
在此示例中,我们将使用 R 编程语言中 ggplot2 包中的 geom_histogram()函数的 alpha 参数,使用 2 个不同的 100 个随机数据集在单个图上创建 2 个不同的直方图。
R
library("ggplot2")
data <- data.frame(values = c(rnorm(100),
                              rnorm(100)),
                   group = c(rep("A", 100),
                             rep("B", 100)))

ggplot(data, aes(x = values, fill = group)) +
geom_histogram(position = "identity", alpha = 0.4, bins = 50)
R
library("ggplot2")
data <- data.frame(values = c(c(6,2,5,4,1,6,1,5,4,7),
                              c(4,1,4,4,5,5,4,6,2,4),
                              c(9,1,5,7,1,10,6,4,1,7)),
                   group = c(rep("A", 10),
                             rep("B", 10),
                             rep("C", 10)))
ggplot(data, aes(x = values, fill = group)) +
geom_histogram(position = "identity", alpha = 0.4, bins = 50)
输出:

示例 2:
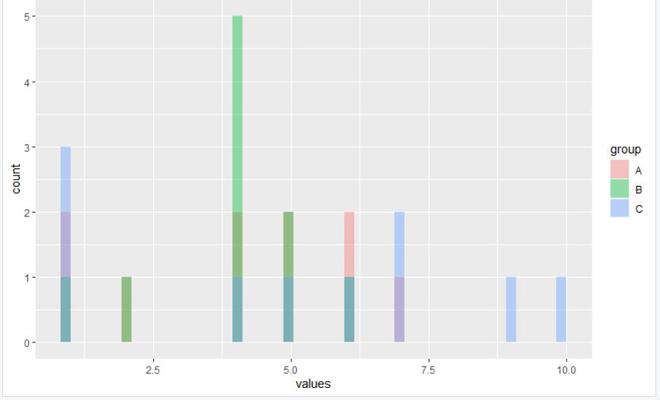
在此示例中,我们将使用 R 编程语言中 ggplot2 包中的 geom_histogram()函数的 alpha 参数,使用 3 个不同的数据在单个图上创建 3 个不同的直方图。
电阻
library("ggplot2")
data <- data.frame(values = c(c(6,2,5,4,1,6,1,5,4,7),
                              c(4,1,4,4,5,5,4,6,2,4),
                              c(9,1,5,7,1,10,6,4,1,7)),
                   group = c(rep("A", 10),
                             rep("B", 10),
                             rep("C", 10)))
ggplot(data, aes(x = values, fill = group)) +
geom_histogram(position = "identity", alpha = 0.4, bins = 50)
输出:
