在R中绘制ggplot2图的不平衡网格
在本文中,我们将看到如何在 R 编程语言中绘制 ggplot2 图的不平衡网格。我们主要使用grid.arrange()和arrangeGrob()函数。以下是这两个函数的简要信息。
- grid.arrange():它将计算不同数量的行和列来组织绘图和形成绘图的嵌套布局
Syntax : grid.arrange(plot, nrow, ncol)
Parameter:
- plot: ggplot2 plot which we want to arrange
- nrow: Number of rows
- ncol: Number of columns
Return: Arrangement of plot
- 安排格罗布():它 函数需要许多参数,例如。 layout_matrix、as.table、respect、top、bottom、left、right 等等。
Syntax : arrangeGrob(…, heights)
Parameter:
- … : ggplot2 plots which we want to arrange on same page
- heights : Heights of those plots
Return: Arrange Multiple Plots on Same Page with different grid
首先,我们应该加载一些将在本示例中进一步使用的 R 包。我们将使用ggplot2包绘制绘图,使用gridExtra在绘图上绘制各种网格。
install.packages("ggplot2")
library("ggplot2")
install.packages("gridExtra")
library("gridExtra")对于散点图的数据,我们使用rnorm()函数为X轴和Y轴选择了大约 50 个随机值,该函数可以生成随机正态值。然后创建一个 DataFrame 并将其分配给“数据”数据对象。
data <- data.frame(x = rnorm(50), y = rnorm(50))现在,我们创建一个使用ggplot()函数散点图和使其使用geom_point()函数,散乱。
下面是实现:
R
# Load Packages
library("ggplot2")
library("gridExtra")

# Create data for Plotting
data <- data.frame(x = rnorm(50), y = rnorm(50))

# Create Simple Scatter Plot
gplot <- ggplot(data, aes(x, y)) + geom_point(col = "green")
gplot
R
# Load Packages
library("ggplot2")
library("gridExtra")

# Create Data for plotting
data <- data.frame(x = rnorm(50), y = rnorm(50))

# Create ggplot2 Scatter Plot
gplot <- ggplot(data, aes(x, y)) + geom_point(col = "green")

# Change the plot grid to half of the plot space.
grid.arrange(gplot, ncol = 2)
R
# Load Packages
library("ggplot2")
library("gridExtra")

# Create Data for plotting
data <- data.frame(x = rnorm(50), y = rnorm(50))

# Create ggplot2 Scatter Plot
gplot <- ggplot(data, aes(x, y)) + geom_point(col = "green")

# Change the plot Horizontal grid to half of the plot space.
grid.arrange(gplot, nrow = 2)
R
# Load Packages
library("ggplot2")
library("gridExtra")

# Create Data for plotting
data <- data.frame(x = rnorm(50), y = rnorm(50))

# Create ggplot2 Scatter Plot
gplot <- ggplot(data, aes(x, y)) +
  geom_point(col = "green")

# Create Multiple Plots with different size of grids.
grid.arrange(gplot,
             arrangeGrob(gplot, gplot,
                         heights = c(0.4, 0.6)),
             ncol = 2)
输出:

简单散点图
更改绘图的垂直网格
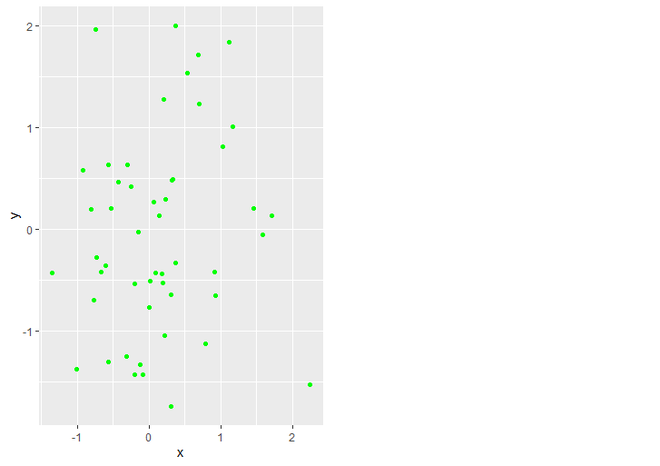
在这里,我们正在更改绘图的垂直网格。我们使用 gridExtra 包的grid.arrange()函数。里面grid.arrange()封装,我们分配gplot(我们的散点图)作为第一个参数和NcoI作为第二个参数。 ncol 只是将绘图区域垂直划分为我们分配给 ncol 的值。在这里,我们使用“ncol = 2”将绘图的垂直网格更改为绘图空间的一半。
代码:
电阻
# Load Packages
library("ggplot2")
library("gridExtra")

# Create Data for plotting
data <- data.frame(x = rnorm(50), y = rnorm(50))

# Create ggplot2 Scatter Plot
gplot <- ggplot(data, aes(x, y)) + geom_point(col = "green")

# Change the plot grid to half of the plot space.
grid.arrange(gplot, ncol = 2)
输出:

半垂直网格散点图
更改绘图的水平网格
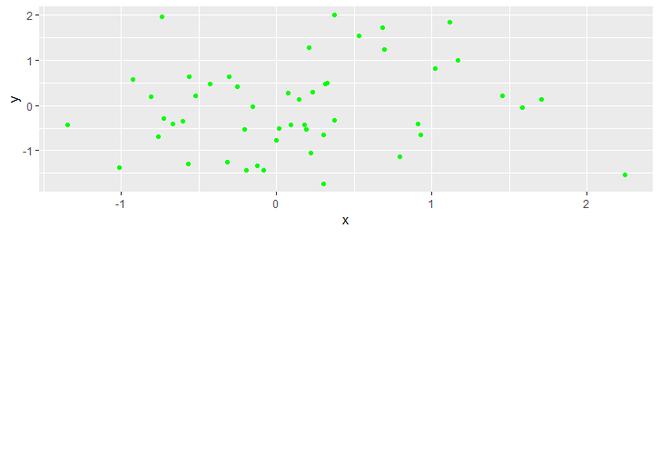
为了改变绘图的水平网格,我们只需将ncol替换为 grid.arrange()函数的nrow参数。 nrow 参数采用我们想要水平分割图的值。在这里,我们使用“nrow = 2”将绘图的水平网格更改为绘图空间的一半。
代码:
电阻
# Load Packages
library("ggplot2")
library("gridExtra")

# Create Data for plotting
data <- data.frame(x = rnorm(50), y = rnorm(50))

# Create ggplot2 Scatter Plot
gplot <- ggplot(data, aes(x, y)) + geom_point(col = "green")

# Change the plot Horizontal grid to half of the plot space.
grid.arrange(gplot, nrow = 2)
输出:

半水平网格散点图
在同一个绘图空间上绘制多个不同网格大小的绘图
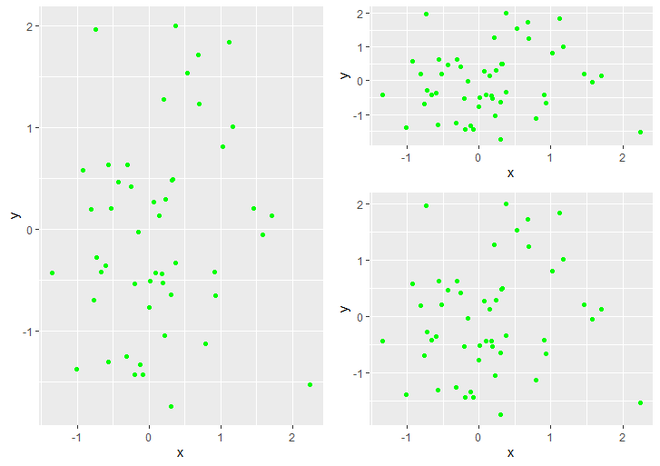
对于绘制多个不同大小的图,我们使用arrangeGrob()作为grid.arrange()函数的第二个参数,它将以每个图形的高度和宽度作为参数。首先,它将 gplot 作为我们要创建的每个图形的参数,然后它还使用heights参数指定每个图形的高度。
代码:
电阻
# Load Packages
library("ggplot2")
library("gridExtra")

# Create Data for plotting
data <- data.frame(x = rnorm(50), y = rnorm(50))

# Create ggplot2 Scatter Plot
gplot <- ggplot(data, aes(x, y)) +
  geom_point(col = "green")

# Create Multiple Plots with different size of grids.
grid.arrange(gplot,
             arrangeGrob(gplot, gplot,
                         heights = c(0.4, 0.6)),
             ncol = 2)
输出:

不同大小网格的多个图