散景 - 注释和图例
先决条件:散景
Bokeh 包括多种类型的注释,允许用户向其可视化添加补充信息。注释用于添加注释或有关主题的更多信息。注释可以是标题、图例、箭头、带、标签等。
为您的数字添加图例有助于正确描述和定义它。因此,更加清晰。散景中的图例很容易实现。它们可以是基本的、自动分组的、手动提及的、明确索引的,也可以是交互式的。
下面给出的示例可以帮助您更好地理解:
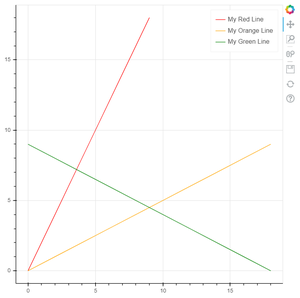
示例:基本图例
Legend_label 参数用于为任一字形添加基本标签。
Python3
from bokeh.plotting import figure, output_file, show

x = [val for val in range(10)]
y = [val for val in range(0, 20, 2)]

output_file("basiclegend.html")

p = figure()

p.line(x, y, legend_label="My Red Line", line_color="red")
p.line(y, x, legend_label="My Orange Line", line_color="orange")
p.line(y[::-1], x, legend_label="My Green Line", line_color="green")

show(p)
Python3
from bokeh.plotting import figure, output_file, show
from bokeh.models import ColumnDataSource

p = figure(x_range=(0.5, 2.5), y_range=(0.5, 2.5))

source = ColumnDataSource(dict(
    x=[1, 1, 2, 2, 1.5],
    y=[1, 2, 1, 2, 1.5],
    color=['red', 'red', 'red', 'red', 'blue'],
    label=['corner', 'corner', 'corner', 'corner', 'center']
))
p.circle(x='x', y='y', radius=0.05, color='color',
         legend_group='label', source=source)

output_file("AutomaticGrouping.html")

show(p)
Python3
from bokeh.plotting import figure, output_file, show

p = figure()

x = [x for x in range(1, 11)]
colors = ['red', 'green', 'blue', 'yellow']
for i in range(2, 6):
    p.line(x, [val*i for val in x], line_width=2, color=colors[i-2],
           alpha=0.8, legend_label='Multiples of {}'.format(i))

p.legend.location = "top_left"
p.legend.click_policy = "hide"
output_file("interactive_legend.html")

show(p)
输出:
示例 2:当我们希望将多个图例项分组为一个时,可以使用自动分组。
蟒蛇3
from bokeh.plotting import figure, output_file, show
from bokeh.models import ColumnDataSource

p = figure(x_range=(0.5, 2.5), y_range=(0.5, 2.5))

source = ColumnDataSource(dict(
    x=[1, 1, 2, 2, 1.5],
    y=[1, 2, 1, 2, 1.5],
    color=['red', 'red', 'red', 'red', 'blue'],
    label=['corner', 'corner', 'corner', 'corner', 'center']
))
p.circle(x='x', y='y', radius=0.05, color='color',
         legend_group='label', source=source)

output_file("AutomaticGrouping.html")

show(p)
输出:

示例 3:交互式图例
蟒蛇3
from bokeh.plotting import figure, output_file, show

p = figure()

x = [x for x in range(1, 11)]
colors = ['red', 'green', 'blue', 'yellow']
for i in range(2, 6):
    p.line(x, [val*i for val in x], line_width=2, color=colors[i-2],
           alpha=0.8, legend_label='Multiples of {}'.format(i))

p.legend.location = "top_left"
p.legend.click_policy = "hide"
output_file("interactive_legend.html")

show(p)
输出: