频率分布在我们生活中无处不在。气象部门,数据科学家,土木工程师几乎所有行业都使用频率分布。这些分布使我们能够从任何数据中获取见解,查看趋势并预测下一个值或数据的行进方向。有两种类型的频率分布-分组和未分组。它们的用法取决于我们正在使用的数据。他们的分析是概率和统计数据中非常重要的部分。让我们详细了解这些概念。
频率分布
频率分布告诉我们频率如何在值上分布。那就是在不同的时间间隔之间有多少个值。它们使我们对大多数值下降的范围和值稀缺的范围有了一个了解。
A frequency distribution is an overview of all values of some variable and the number of times they occur.
频率分布具有以下类型:
- 分组的频率分布-将值划分为不同的时间间隔,然后对它们的频率进行计数。
- 未分组的频率分布-提及变量的所有不同值,并对它们的频率进行计数。
问题:假设我们有一个团队在10场不同比赛中进球的数据。
1,0,0,3,2,0,2,3,1,1
绘制一个频率表来表示该数据。
解决方案:
Since there are less number of distinct values. We don’t have to group the data. We can just count the distinct values and their frequency.
This frequency table can also be represented in the form of a bar graph.

频率分布也可以由直线曲线表示。下图给出了上述问题的直线曲线。

同样,如果有很多不同的值,则可以像前面的情况一样对它们进行分组并进行分组的频率分布。
累积频率分布
累积频率定义为以前的值或直到当前频率为止的所有频率之和。表示使用累积频率的频率分布的频率分布称为累积频率分布。累积频率分布有两种类型:
- 小于类型:我们将当前间隔之前的所有频率相加。
- 不仅仅是类型:我们将当前间隔之后的所有频率相加。
让我们看一下如何通过示例来表示累积频率分布,
问题1:下表提供了维拉特·科利(Virat Kohli)在最近25场T-20比赛中得分的得分数值。用小于类型的累积频率分布的形式表示数据:
| Number of Goals | Frequency |
| 0 | 3 |
| 1 | 3 |
| 2 | 2 |
| 3 | 2 |
| Total | 10 |
解决方案:
Since there are a lot of distinct values, we’ll express this in the form of grouped distributions with intervals like 0-10, 10-20 and so. First let’s represent the data in the form of grouped frequency distribution.
| Runs | Frequency |
| 0-10 | 2 |
| 10-20 | 2 |
| 20-30 | 1 |
| 30-40 | 4 |
| 40-50 | 4 |
| 50-60 | 5 |
| 60-70 | 1 |
| 70-80 | 2 |
| 80-90 | 2 |
| 90-100 | 1 |
Now we will convert this frequency distribution into cumulative frequency distribution by summing up the values of current interval and all the previous intervals.
| Runs | Frequency |
| 0-10 | 2 |
| 10-20 | 4 |
| 20-30 | 5 |
| 30-40 | 9 |
| 40-50 | 13 |
| 50-60 | 18 |
| 60-70 | 19 |
| 70-80 | 21 |
| 80-90 | 23 |
| 90-100 | 25 |
This table represents the cumulative frequency distribution.
问题2:以累积频率分布线曲线的形式表示上面的累积频率分布表。
解决方案:
To plot the line curve for the above table, use the mid-point of each interval and the corresponding value.

变异系数
我们知道如何测量系列的离散度。我们可以使用均值和标准差来描述值的离散度。但是有时在比较两个序列或频率分布时会变得有些困难,因为有时两者都有不同的单位。
例如:假设我们有两个系列,关于一个班级的学生身高。现在,一个系列以厘米为单位测量高度,另一个系列以米为单位。理想情况下,两者应具有相同的色散,但是测量色散的方法取决于我们要测量的单位。这使这种比较变得困难。为了解决此类问题,我们定义了变异系数。
Coefficient of Variation is defined as,
![]()
Here, ![]() and
and ![]() are the standard deviation and mean of the series.
are the standard deviation and mean of the series.
CV较大的序列被认为比其他序列具有更大的可变性。 CV较小的序列据说比其他序列更一致。
比较具有相同均值的两个频率分布
我们有两个频率分布。比方说![]() 和
和![]() 是第一个系列的标准差和均值,
是第一个系列的标准差和均值, ![]() 和
和![]() 是第二个系列的标准差和均值。
是第二个系列的标准差和均值。
第一个系列的简历= ![]()
第二系列的简历= ![]()
我们得到两个序列的均值相同,即
![]()
所以,现在这两个系列的简历都是
第一个系列的简历= ![]()
第二系列的简历= ![]()
请注意,现在这两个系列只能与标准偏差的值进行比较。因此,可以说,对于具有相同均值的两个序列,偏差较大的序列可以被认为比另一个序列具有更大的可变性。
让我们看一下这些概念的一些示例:
样本问题
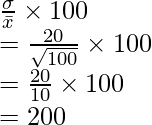
问题1:假设我们有一个序列,平均值为20,方差为100。找出变异系数。
解决方案:
We know the formula for Coefficient of Variation,
![]()
Given mean ![]() = 20 and variance
= 20 and variance ![]() = 100.
= 100.
Substituting the values in the formula,

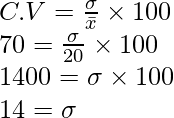
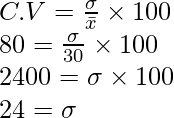
问题2:给定两个具有70和80的变异系数的序列。平均值为20和30。找到两个序列的标准偏差值。
解决方案:
In this question we need to apply the formula for CV and substitute the given values.
Standard Deviation of first series.

Thus, the standard deviation of first series = 14.
Standard Deviation of second series.

Thus, the standard deviation of first series = 24.
问题3:绘制频率分布表和频率分布曲线以获取以下数据:
2,3,1,4,2,2,3,1,4,4,4,2,2,2
解决方案:
Since there are only very few distinct values in the series, we will plot the ungrouped frequency distribution.
| Value | Frequency |
| 1 | 2 |
| 2 | 6 |
| 3 | 2 |
| 4 | 4 |
| Total | 14 |
The figure below represents the line curve for the given table.

问题4:下表列出了夏季25天在海得拉巴记录的温度值。用小于类型的累积频率分布的形式表示数据:
| 45 | 34 | 50 | 75 | 22 |
| 56 | 63 | 70 | 49 | 33 |
| 0 | 8 | 14 | 39 | 86 |
| 92 | 88 | 70 | 56 | 50 |
| 57 | 45 | 42 | 12 | 39 |
解决方案:
Since there are so many distinct values here, we will use grouped frequency distribution. Let’s say the intervals are 20-25, 25-30, 30-35. Frequency distribution table can be made by counting the number of values lying in these intervals.
| Temperature | Number of Days |
| 20-25 | 2 |
| 25-30 | 10 |
| 30-35 | 13 |
This is the grouped frequency distribution table. It can be converted into cumulative frequency distribution by adding the previous values.
| Temperature | Number of Days |
| 20-25 | 2 |
| 25-30 | 12 |
| 30-35 | 25 |
The table above is the cumulative frequency distribution of the above data. Now let’s represent this in the form line curve for cumulative frequency distribution.
