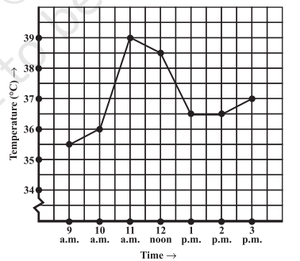
问题1:下图显示了每小时记录的医院病人的温度。

(i)下午1点患者的体温是多少?
解决方案:
The patient’s temperature at 1 p.m. was 36.5oC.
(ii)患者的体温何时是38.5°C?
解决方案:
The patient’s temperature was 38.5oC at 12 noon.
(iii)在给定的时间内,患者的体温是相同的两次。这两次是什么?
解决方案:
Patient’s temperature at 2 p.m. was the same as the patient’s temperature at 1 p.m. (36.5oC).
(iv)1.30 pm的温度是多少?您是如何得出答案的?
解决方案:
Patient’s temperature was 36.5oC at 1:30 p.m.
The line in between 1 p.m. and 2 p.m. represents 1:30 p.m. And the line in between 36oC and 37oC
represents 36.5oC. Therefore the temperature at 1:30 p.m. was 36.5oC.
(v)在哪些时期患者的体温呈上升趋势?
解决方案:
Patient’s temperature showed an upward trend between 9 a.m. and 11 a.m. and also the patient’s
temperature showed an upward trend between 2 p.m. and 3 p.m. for the second time.
问题2:以下折线图显示了一家制造公司的年销售额。

(a)(i)2002(ii)2006的销售额是多少?
解决方案:
(i) Sales in 2002 was 4 crore rupees.
(ii) Sales in 2006 was 8 crore rupees.
(b)(i)2003(ii)2005的销售额是多少?
解决方案:
(i) sales in 2003 were 7 crore rupees.
(ii) sales in 2005 were 10 crore rupees.
(c)计算2002年和2006年的销售额之间的差额。
解决方案:
The difference between the sales in 2002 and 2006 is 4 crore rupees.
Explanation: Sales in 2002 was 4 crore rupees Sales in 2006 were 8 crore rupees difference between 8 crore and 4 crore rupees is 4 crore rupees therefore, the difference between the sales in 2002 and 2006 is 4 crore rupees.
(d)哪一年的销售额与前一年相比差异最大?
解决方案:
In 2005 there was the greatest difference between the sales as compared to its previous year (2004).
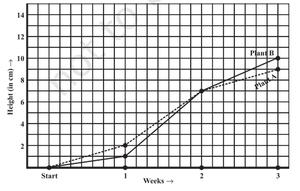
问题3:为在植物学中进行实验,在相似的实验室条件下种植了两种不同的植物,即植物A和植物B。在每个星期的末尾测量他们的身高,持续3周。结果显示在下图中。

(a)(i)2周(ii)3周后植物A的高度是多少?
解决方案:
(i) Plant A was 7 cm’s high after 2 weeks.
(ii) Plant A was 9 cm’s high after 3 weeks.
(b)在(i)2周(ii)3周后,植物B有多高?
解决方案:
(i) Plant B was 7 cm’s high after 2 weeks.
(ii) Plant B was 10 cm’s high after 3 weeks.
(c)在第3周中,植物A生长了多少?
解决方案:
Plant A’s height after 2 weeks was 7 cm’s and
Plant A’s height after 3 weeks was 9 cm’s
therefore, Plant A grew 2 cm’s in the 3rd week (which is 9 cm’s – 7 cm’s).
(d)从第二周末到第三周末,植物B生长了多少?
解决方案:
Plant B’s height after 2 weeks was 7 cm’s and
Plant B’s height after 3 weeks was 10 cm’s
therefore, Plant B grew 3 cm’s from the end of the 2nd week to the end of the 3rd week (which is 10 cm’s – 7 cm’s).
(e)植物A在哪一周生长最快?
解决方案:
2nd week.
Explanation: Plant A grew 2 cm’s in 1st week, 5 cm’s in 2nd week, 2 cm’s in 3rd week. Therefore, Plant A grew most in 2nd week.
(f)植物B在哪一周生长最少?
解决方案:
1st week.
Explanation: Plant B grew 1 cm in 1st week, 6 cm’s in 2nd week, 3 cm’s in 3rd week. Therefore, Plant B grew Least in 1st week.
(g)在所示的任何一周内,两个植物的高度相同吗?指定。
解决方案:
Yes, after 2 weeks both the plants are at the same height (which is 7 cm).
问题4:下图显示了一周中每一天的温度预测和实际温度。

(a)预测温度在哪几天与实际温度相同?
解决方案:
On Tuesday, Friday, Sunday forecast temperature was the same as the actual temperature.
(b)一周最高预报温度是多少?
解决方案:
35oC was the maximum forecast temperature during the week.
(c)一周的最低实际温度是多少?
解决方案:
15oC was the minimum actual temperature during the week.
(d)哪一天的实际温度与预测的温度相差最大?
解决方案:
On Thursday, the difference between actual temperature and forecast temperature is 15oC and it is
the maximum among all the days.
问题5:使用下表绘制线性图。
(a)一个山坡城市在不同年份下雪的天数。
|
Year |
2003 |
2004 |
2005 |
2006 |
|---|---|---|---|---|
|
Days |
8 |
10 |
5 |
12 |
解决方案:

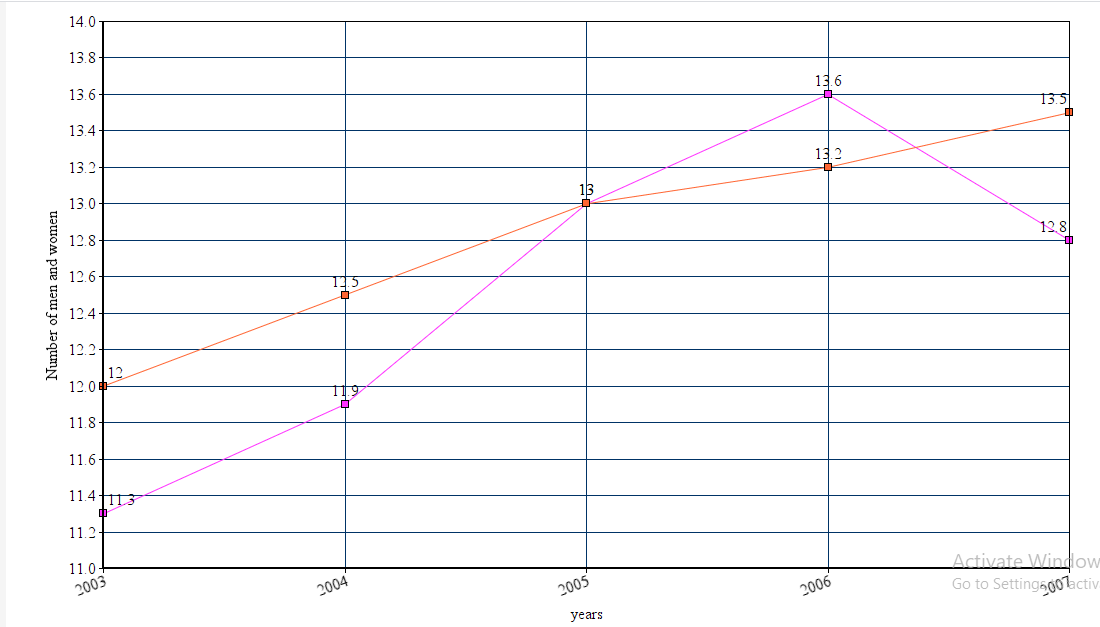
(b)不同年份一个村庄的男女人口(以千计)。
|
Year |
2003 |
2004 |
2005 |
2006 |
2007 |
|---|---|---|---|---|---|
|
Number of Men |
12 |
12.5 |
13 |
13.2 |
13.5 |
|
Number of Women |
11.3 |
11.9 |
13 |
13.6 |
12.8 |
解决方案:

问题6:快递员从城镇骑车到附近的郊区,将包裹运送给商人。下图显示了他在不同时间与城镇的距离。

(a)时间轴的比例是多少?
解决方案:
4 Units = 1 hour
Therefore, 1 Unit = 1/4 hour
1 Unit = 15 mins.
(b)该人花了多少时间旅行?
解决方案:
The person traveled from 8:00 a.m. to 11:30 a.m.
Therefore, the person took 3 hours and 30 mins to travel.
(c)商人的所在地离镇有多远?
解决方案:
The distance between the place of a merchant from the town is 22 km.
(d)该人是否在途中停下了脚步?解释。
解决方案:
Yes, the person stopped on his way.
In between 10:00 a.m. and 10:30 a.m., his distance from the town remained the same.
(e)他在哪个时期骑的最快?
解决方案:
In between 8:00 a.m. and 9:00 a.m. (he traveled 10 km during this period and it is the maximum).
问题7:是否可以显示以下时间-温度图?证明你的答案。
(一世)

解决方案:
Yes, this graph shows the raise in temperature with respect to time.
(ii)

解决方案:
Yes, this graph shows the decrease in temperature with respect to time.
(iii)

解决方案:
No, Temperature cannot have different values at a given time.
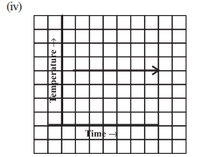
(iv)

解决方案:
Yes, this graph says the temperature is constant with respect to time.