如何从 R 中的线性回归模型中提取截距
线性回归是机器学习中的一种预测分析方法。它主要用于检查两件事:
- 如果一组预测变量(独立的)可以很好地预测结果变量(相关的)。
- 哪些预测变量在预测结果变量方面显着以及以何种方式显着,这分别由估计值的大小和符号决定。
线性回归与一个结果变量和一个或多个预测变量一起使用。简单线性回归适用于一个结果和一个预测变量。简单线性回归模型本质上是一个形式为y = c + b*x的线性方程;其中 y 是因变量(结果),x 是自变量(预测变量),b 是线的斜率;也称为回归系数,c 是截距;标记为常数。
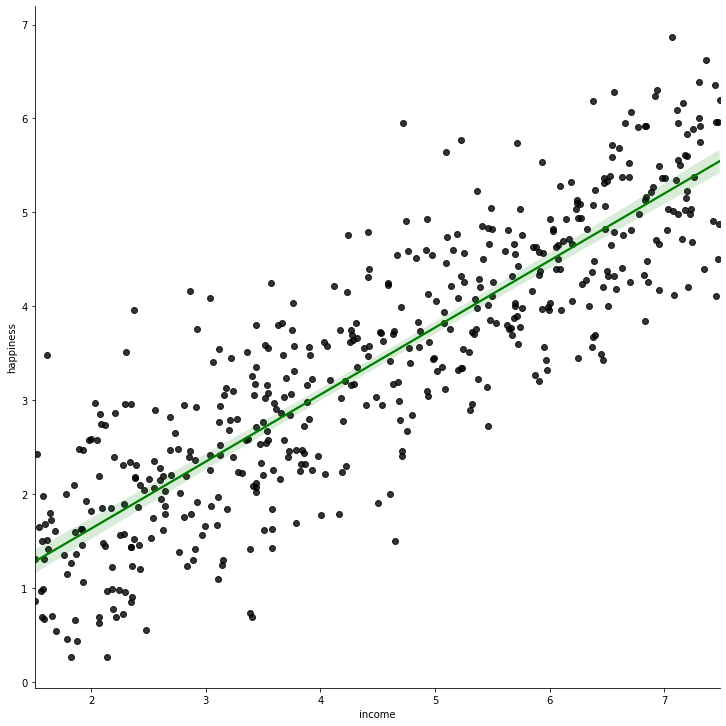
线性回归线是最适合预测变量(独立)和预测变量(相关)之间的图形的线。

收入与幸福数据集的回归线(绿色实线)
上图中,绿线为最佳拟合线;并将其作为给定数据集的回归线。
确定回归线最流行的方法之一是最小二乘法。这种方法本质上是通过最小化每个数据点的垂直偏差的平方和(位于线上的点的偏差为 0)来找到最适合数据的线。由于偏差是平方的,因此偏差的正值和负值之间没有抵消。
方法:
- 为线性回归选择一个合适的问题陈述。我们将选择收入.data_。
- 安装和加载用于绘图/可视化的包。您可以将数据点可视化以查看数据是否适合线性回归。
- 读取数据框中的数据集。您还可以在阅读后可视化数据框(示例如下面的代码所示)。
- 使用lm()函数从数据创建线性回归模型。将创建的模型存储在变量中。
- 探索模型。

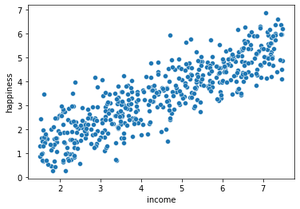
相互绘制因变量和自变量后的散点图
步骤 1:安装并加载所需的包。阅读并探索数据集。您还可以使用setwd()函数设置笔记本的工作目录,将目录的路径(存储数据集的位置)作为参数传递。
R
# install the packages and load them
install.packages("ggplot2")
install.packages("tidyverse")
library(ggplot2)
library(tidyverse)

# Read the data into a data frame
dataFrame <- read.csv("income_data.csv")

# Explore the data frame
head(dataFrame)
R
# Allocate the columns to different variables
# x is the independent variable
x <- dataFrame$income

# y is the dependent variable
y <- dataFrame$happiness

# Plot the graph between dependent and independent variable
plot(x, y)
R
# Create the linear model from the data.
# y ~ x denotes y dependent and x is the independent variable
model <- lm(y~x)

# Print the model to check the intercept
model
R
model_summary <- summary(model)

intercept_value <- model_summary$coefficients[1,1]

intercept_value
R
model_summary <- summary(model)
model_summary
输出:

第二步:分离数据集的变量。可视化数据集。
电阻
# Allocate the columns to different variables
# x is the independent variable
x <- dataFrame$income

# y is the dependent variable
y <- dataFrame$happiness

# Plot the graph between dependent and independent variable
plot(x, y)
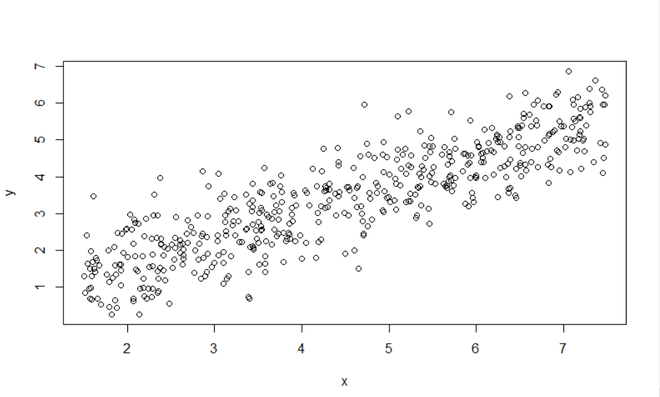
输出:

X(收入)与 Y(幸福)图
第三步:从数据中清除线性回归模型。训练并查看模型。
电阻
# Create the linear model from the data.
# y ~ x denotes y dependent and x is the independent variable
model <- lm(y~x)

# Print the model to check the intercept
model
输出:
Call:
lm(formula = y ~ x)

Coefficients:
(Intercept)            x
     0.2043       0.7138
如您所见,截距的值为 0.2043。但是如何在变量中获得这个值呢?
提取截距值
我们可以使用创建的模型的摘要来提取截距的值。
代码:
电阻
model_summary <- summary(model)

intercept_value <- model_summary$coefficients[1,1]

intercept_value
输出:
0.204270396204177如果您尝试打印模型 (model_summary) 变量的摘要,您将看到下面的系数。它是一个二维矩阵,其中存储了所有上述系数。因此,[1,1] 将对应于(回归线的)预测截距。
电阻
model_summary <- summary(model)
model_summary
输出:

这就是我们从 R 中的线性回归模型中提取截距值的方法。