从 R 中的回归模型中删除截距
在本文中,我们将讨论如何在 R 编程语言中从回归模型中删除截距。
从线性回归模型中提取截距
为了从 R 语言中的线性回归模型中提取截距,我们使用了 R 语言的 summary()函数。我们首先使用 lm()函数创建线性回归模型。 lm()函数用于将线性模型拟合到 R 语言中的数据帧。可用于进行回归、单层方差分析、协方差分析,预测不在数据框内的数据对应的值。然后我们使用 summary()函数来检索该模型的统计摘要,其中还包含拟合模型所做的截距信息。
Syntax:
linear_model <- lm( formula, data )
summary( linear_model )
Parameter:
- formula: determines the formula for the linear model.
- data: determines the name of the data frame that contains the data.
示例:这里,是 R 语言中带有截距的线性回归模型。
R
# sample data frame
sample_data <- data.frame( x1= c(2,3,5,4,8),
                  x2= c(0,3,5,6,23),
                  y= c(1,6,9,15,29))

# fit linear model
linear_model <- lm(y ~ x1+x2, data=sample_data)

# view summary of linear model
summary(linear_model)
R
# sample data frame
sample_data <- data.frame( x1= c(2,3,5,4,8),
                  x2= c(0,3,5,6,23),
                  y= c(1,6,9,15,29))

# fit linear model
linear_model <- lm(y ~ x1+x2, data=sample_data)

# visualize linear model
plot( sample_data$x1, sample_data$y, col= "blue", pch=16 )
points( sample_data$x2, sample_data$y, col="red", pch=16 )
abline(linear_model, col="green", lwd=2 )
R
# sample data frame
sample_data <- data.frame( x1= c(2,3,5,4,8),
                  x2= c(0,3,5,6,23),
                  y= c(1,6,9,15,29))

# fit linear model
linear_model <- lm(y ~ 0+x1+x2, data=sample_data)

# view summary of linear model
summary(linear_model)
R
# sample data frame
sample_data <- data.frame( x1= c(2,3,5,4,8),
                  x2= c(0,3,5,6,23),
                  y= c(1,6,9,15,29))

# fit linear model
linear_model <- lm(y~x1+x2+0, data=sample_data)

# visualize linear model
plot( sample_data$x1, sample_data$y,
     col= "blue", pch=16, xlim=c(0,10))

points( sample_data$x2, sample_data$y,
       col="red", pch=16 )
abline(linear_model, col="green", lwd=2 )
输出:
Call:
lm(formula = y ~ x1 + x2, data = sample_data)
Residuals:
     1       2       3       4       5
-1.9974 -0.6673 -1.1100  4.6628 -0.8880
Coefficients:
           Estimate Std. Error t value Pr(>|t|)
(Intercept)   1.5032     7.4142   0.203    0.858
x1            0.7471     2.7159   0.275    0.809
x2            0.9743     0.6934   1.405    0.295
这里,截距估计为 1.5032,在线性模型摘要的系数部分可以清楚地看到。
回归模型的可视化
为了在 R 语言中可视化线性回归模型,我们使用 plot()函数绘制数据点的散点图,然后使用 abline() pot 绘制回归线。
Syntax:
plot( datax, datay )
abline( linear_model)
Parameter:
- datax and datay: determine the value for the x-axis and y-axis variables.
- linear_model: determines the linear model for visualization.
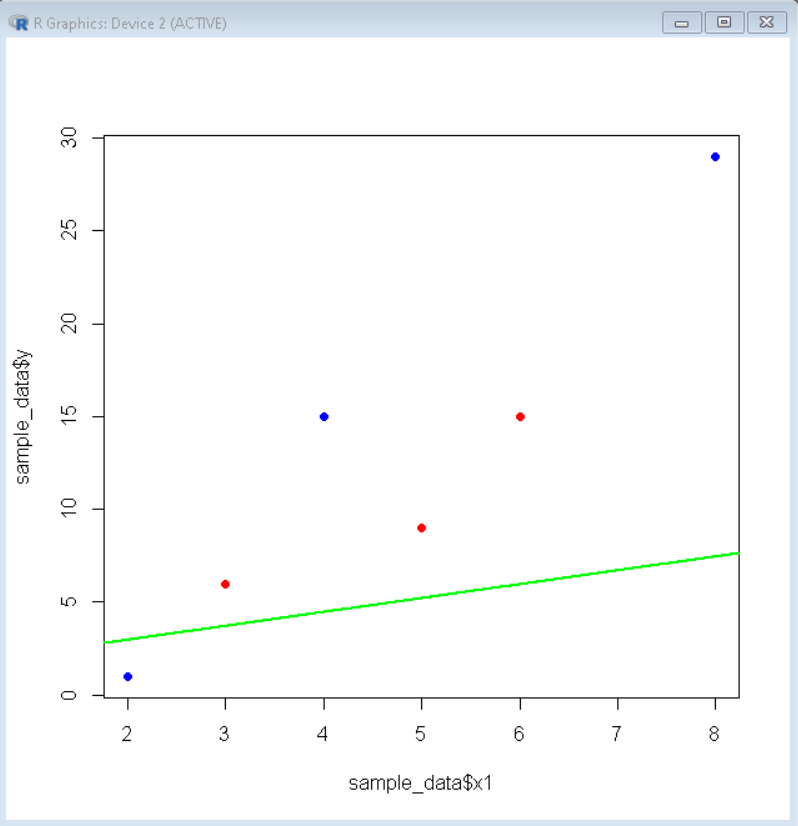
示例:这里是带有截距的线性模型的可视化。
R
# sample data frame
sample_data <- data.frame( x1= c(2,3,5,4,8),
                  x2= c(0,3,5,6,23),
                  y= c(1,6,9,15,29))

# fit linear model
linear_model <- lm(y ~ x1+x2, data=sample_data)

# visualize linear model
plot( sample_data$x1, sample_data$y, col= "blue", pch=16 )
points( sample_data$x2, sample_data$y, col="red", pch=16 )
abline(linear_model, col="green", lwd=2 )
输出:

从线性回归模型中删除截距
为了从线性模型中删除截距,我们手动设置截距为零。这样,我们可能不一定得到最佳拟合线,但保证的线穿过原点。要将截距设置为零,我们在拟合公式前添加 0 和加号。这使得截距为零。
Syntax:
linear_model <- lm( var1 ~ 0+ formula, data )
summary( linear_model )
Parameter:
- var1: determines the variable on which data is to be fitted.
- formula: determines the formula for the linear model.
- data: determines the name of the data frame that contains the data.
示例:这里是 R 语言中没有截距的线性回归模型。
R
# sample data frame
sample_data <- data.frame( x1= c(2,3,5,4,8),
                  x2= c(0,3,5,6,23),
                  y= c(1,6,9,15,29))

# fit linear model
linear_model <- lm(y ~ 0+x1+x2, data=sample_data)

# view summary of linear model
summary(linear_model)
输出:
Call:
lm(formula = y ~ 0 + x1 + x2, data = sample_data)
Residuals:
1 2 3 4 5
-1.5422 -0.3795 -1.6325 4.7831 -0.8434
Coefficients:
Estimate Std. Error t value Pr(>|t|)
x1 1.2711 0.6886 1.846 0.1621
x2 0.8554 0.3056 2.799 0.0679 .
—
Signif. codes: 0 ‘***’ 0.001 ‘**’ 0.01 ‘*’ 0.05 ‘.’ 0.1 ‘ ’ 1
Residual standard error: 3.097 on 3 degrees of freedom
Multiple R-squared: 0.9757, Adjusted R-squared: 0.9595
F-statistic: 60.22 on 2 and 3 DF, p-value: 0.003789
在这里,我们在摘要部分的系数中没有截距,因为截距设置为零。
无截距的线性模型可视化
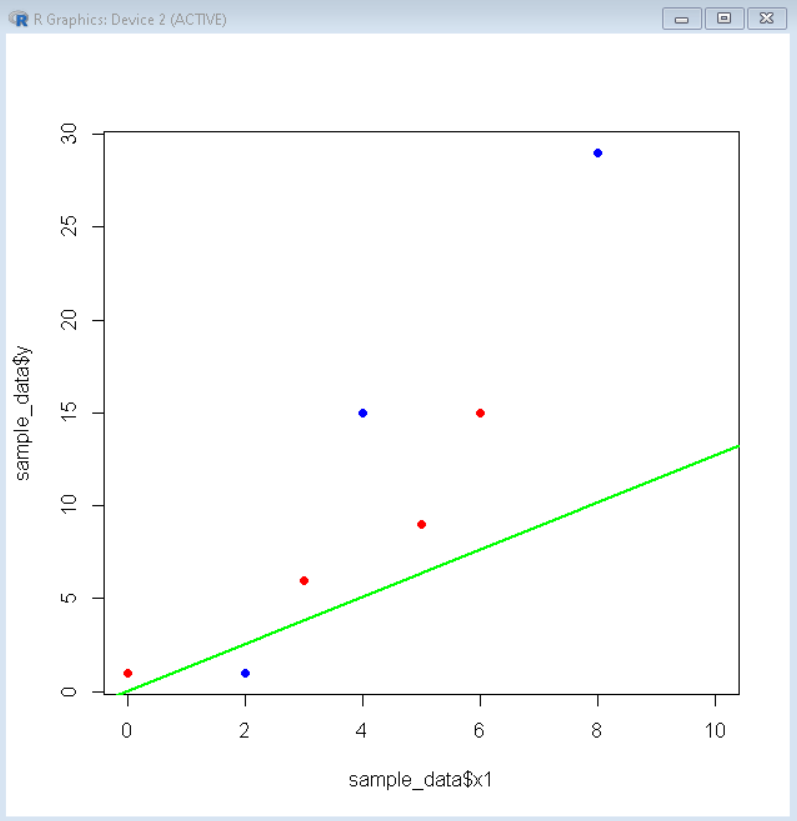
为了可视化没有截距的线性模型,我们在拟合公式前添加零和加号(+)。然后,我们使用 plot() 和 abline() 函数来可视化线性回归模型。
示例:这里是一个没有截距的线性回归模型图。
R
# sample data frame
sample_data <- data.frame( x1= c(2,3,5,4,8),
                  x2= c(0,3,5,6,23),
                  y= c(1,6,9,15,29))

# fit linear model
linear_model <- lm(y~x1+x2+0, data=sample_data)

# visualize linear model
plot( sample_data$x1, sample_data$y,
     col= "blue", pch=16, xlim=c(0,10))

points( sample_data$x2, sample_data$y,
       col="red", pch=16 )
abline(linear_model, col="green", lwd=2 )
输出:
