K- 表示使用 SciPy 进行聚类
先决条件: K-Means 聚类
K-Means 聚类是一种划分方法,每个聚类都将用计算的质心表示。集群中的所有数据点与计算的质心的距离最小。
Scipy是一个开源库,可用于复杂的计算。它主要用于 NumPy 数组。可以通过运行下面给出的命令来安装它。
pip install scipy
它具有用于集群过程的专用包。有两个模块可以提供聚类方法。
- 集群.vq
- 集群层次结构
集群.vq
该模块提供了与 K-Means 聚类方法一起使用的矢量量化功能。矢量的量化在减少失真和提高精度方面起着主要作用。大多数情况下,这里的失真是使用质心和每个向量之间的欧几里德距离计算的。基于此,向量 od 数据点被分配给一个集群。
集群层次结构
该模块提供了一般层次聚类及其类型(例如凝聚聚类)的方法。它具有各种例程,可用于在层次结构上应用统计方法、可视化集群、绘制集群、检查集群中的链接以及检查两个不同的层次结构是否等效。
在本文中,cluster.vq 模块将用于进行 K-Means 聚类。
使用 Scipy 库进行 K-Means 聚类
可以通过执行以下步骤对给定数据进行 K 均值聚类。
- 标准化数据点。
- 计算质心(称为代码,质心的二维数组称为代码簿)。
- 形成集群并分配数据点(称为码本映射)。
cluster.vq.whiten()
该方法用于对数据点进行归一化。当考虑的属性具有不同的单位时,归一化非常重要。例如,如果长度以米为单位,宽度以英寸为单位,则向量可能会产生不等的方差。在执行 K-Means 聚类以获得准确的聚类时,始终首选具有单位方差。因此,数据数组必须在任何其他步骤之前传递给 whiten() 方法。
cluster.vq.whiten(input_array, check_finite)
Parameters:
- input_array : The array of data points to be normalized.
- check_finite : If set to true, checks whether the input matrix contains only finite numbers. If set to false, ignores checking.
cluster.vq.kmeans()
这个 vq 模块有两个方法,即 kmeans() 和 kmeans2()。
kmeans()方法使用阈值,该阈值在最后一次迭代中变得小于或等于失真变化时,算法终止。此方法返回计算的质心以及观测值与质心之间的欧几里德距离的平均值。
cluster.vq.kmeans(input_array, k, iterations, threshold, check_finite)
Parameters:
- input_array : The array of data points to be normalized.
- k : No.of.clusters (centroids)
- iterations : No.of.iterations to perform kmeans so that distortion is minimized. If k is specified it is ignored.
- threshold : An integer value which if becomes less than or equal to change in distortion in last iteration, the algorithm terminates.
- check_finite : If set to true, checks whether the input matrix contains only finite numbers. If set to false, ignores checking.
kmeans2()方法不使用阈值来检查收敛。它有更多的参数来决定质心的初始化方法,一种处理空簇的方法,以及验证输入矩阵是否只包含有限数的方法。此方法返回质心和向量所属的集群。
cluster.vq.kmeans2(input_array, k, iterations, threshold, minit, missing, check_finite)
Parameters:
- input_array : The array of data points to be normalized.
- k : No.of.clusters (centroids)
- iterations : No.of.iterations to perform kmeans so that distortion is minimized. If k is specified it is ignored.
- threshold : An integer value which if becomes less than or equal to change in distortion in last iteration, the algorithm terminates.
- minit : A string which denotes the initialization method of the centroids. Possible values are ‘random’, ‘points’, ‘++’, ‘matrix’.
- missing : A string which denotes action upon empty clusters. Possible values are ‘warn’, ‘raise’.
- check_finite : If set to true, checks whether the input matrix contains only finite numbers. If set to false, ignores checking.
cluster.vq.vq()
此方法将观测值映射到由 kmeans() 方法计算的适当质心。它要求对输入矩阵进行归一化。它将归一化输入和生成的码本作为输入。它返回观测对应的码本中的索引以及观测与其代码(质心)之间的距离。
二维数组数据的K 均值聚类
第一步:导入需要的模块。
Python3
# import modules
import numpy as np
from scipy.cluster.vq import whiten, kmeans, vq, kmeans2
Python3
# observations
data = np.array([[1, 3, 4, 5, 2],
                 [2, 3, 1, 6, 3],
                 [1, 5, 2, 3, 1],
                 [3, 4, 9, 2, 1]])

# normalize
data = whiten(data)

print(data)
Python3
# code book generation
centroids, mean_value = kmeans(data, 3)

print("Code book :\n", centroids, "\n")
print("Mean of Euclidean distances :",
      mean_value.round(4))
Python3
# mapping the centroids
clusters, distances = vq(data, centroids)

print("Cluster index :", clusters, "\n")
print("Distance from the centroids :", distances)
Python3
# assign centroids and clusters
centroids, clusters = kmeans2(data, 3,
                              minit='random')

print("Centroids :\n", centroids, "\n")
print("Clusters :", clusters)
Python3
# import modules
import matplotlib.pyplot as plt
import numpy as np
from scipy.cluster.vq import whiten, kmeans, vq

# load the dataset
dataset = np.loadtxt(r"{your-path}\diabetes-train.csv",
                     delimiter=",")

# excluding the outcome column
dataset = dataset[:, 0:8]

print("Data :\n", dataset, "\n")

# normalize
dataset = whiten(dataset)

# generate code book
centroids, mean_dist = kmeans(dataset, 2)
print("Code-book :\n", centroids, "\n")

clusters, dist = vq(dataset, centroids)
print("Clusters :\n", clusters, "\n")

# count non-diabetic patients
non_diab = list(clusters).count(0)

# count diabetic patients
diab = list(clusters).count(1)

# depict illustration
x_axis = []
x_axis.append(diab)
x_axis.append(non_diab)

colors = ['green', 'orange']

print("No.of.diabetic patients : " + str(x_axis[0]) +
      "\nNo.of.non-diabetic patients : " + str(x_axis[1]))

y = ['diabetic', 'non-diabetic']

plt.pie(x_axis, labels=y, colors=colors, shadow='true')
plt.show()
第 2 步:导入/生成数据。规范化数据。
蟒蛇3
# observations
data = np.array([[1, 3, 4, 5, 2],
                 [2, 3, 1, 6, 3],
                 [1, 5, 2, 3, 1],
                 [3, 4, 9, 2, 1]])

# normalize
data = whiten(data)

print(data)
输出

第 3 步:计算质心并使用kmeans()方法生成用于映射的代码簿
蟒蛇3
# code book generation
centroids, mean_value = kmeans(data, 3)

print("Code book :\n", centroids, "\n")
print("Mean of Euclidean distances :",
      mean_value.round(4))
输出

第 4 步:将上一步计算的质心映射到集群。
蟒蛇3
# mapping the centroids
clusters, distances = vq(data, centroids)

print("Cluster index :", clusters, "\n")
print("Distance from the centroids :", distances)
输出

考虑与kmeans2()相同的示例。这不需要调用vq() 方法的额外步骤。重复步骤 1 和 2,然后使用以下代码段。
蟒蛇3
# assign centroids and clusters
centroids, clusters = kmeans2(data, 3,
                              minit='random')

print("Centroids :\n", centroids, "\n")
print("Clusters :", clusters)
输出

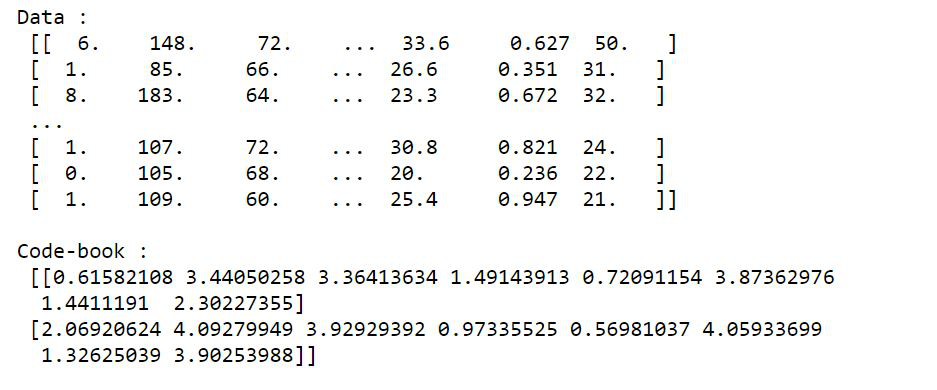
示例 2:糖尿病数据集的K 均值聚类
该数据集包含以下属性,根据这些属性将患者置于糖尿病集群或非糖尿病集群中。
- 怀孕
- 葡萄糖
- 血压
- 皮肤厚度
- 胰岛素
- 体重指数
- 糖尿病谱系函数
- 年龄
蟒蛇3
# import modules
import matplotlib.pyplot as plt
import numpy as np
from scipy.cluster.vq import whiten, kmeans, vq

# load the dataset
dataset = np.loadtxt(r"{your-path}\diabetes-train.csv",
                     delimiter=",")

# excluding the outcome column
dataset = dataset[:, 0:8]

print("Data :\n", dataset, "\n")

# normalize
dataset = whiten(dataset)

# generate code book
centroids, mean_dist = kmeans(dataset, 2)
print("Code-book :\n", centroids, "\n")

clusters, dist = vq(dataset, centroids)
print("Clusters :\n", clusters, "\n")

# count non-diabetic patients
non_diab = list(clusters).count(0)

# count diabetic patients
diab = list(clusters).count(1)

# depict illustration
x_axis = []
x_axis.append(diab)
x_axis.append(non_diab)

colors = ['green', 'orange']

print("No.of.diabetic patients : " + str(x_axis[0]) +
      "\nNo.of.non-diabetic patients : " + str(x_axis[1]))

y = ['diabetic', 'non-diabetic']

plt.pie(x_axis, labels=y, colors=colors, shadow='true')
plt.show()
输出


