📌 相关文章
- Bokeh-轴
- Bokeh-轴(1)
- Bokeh-使用Bokeh子命令
- Bokeh-使用Bokeh子命令(1)
- Bokeh-扩展Bokeh
- Bokeh-扩展Bokeh(1)
- Python入门
- Python入门(1)
- python bokeh - Python (1)
- Bokeh-服务器(1)
- Bokeh-服务器
- Bokeh教程
- Bokeh教程(1)
- Bokeh-简介
- Bokeh-简介(1)
- Python Bokeh – 颜色类
- Python Bokeh – 颜色类(1)
- 安装和入门
- 安装和入门(1)
- Bokeh-熊猫
- Bokeh-熊猫(1)
- python bokeh - Python 代码示例
- 讨论Bokeh(1)
- 讨论Bokeh
- Python Bokeh - 制作饼图
- Python Bokeh - 制作饼图(1)
- Bokeh-导出图(1)
- Bokeh-导出图
- Bokeh-区域图
📜 Bokeh-入门
📅 最后修改于: 2020-11-09 05:09:21 🧑 作者: Mango
在两个numpy数组之间创建简单的线图非常简单。首先,从bokeh.plotting模块中导入以下功能-
from bokeh.plotting import figure, output_file, show
Figure()函数创建一个新的图形进行绘制。
output_file()函数用于指定一个HTML文件来存储输出。
show()函数在笔记本电脑的浏览器中显示Bokeh图形。
接下来,设置两个numpy数组,其中第二个数组是first的正弦值。
import numpy as np
import math
x = np.arange(0, math.pi*2, 0.05)
y = np.sin(x)
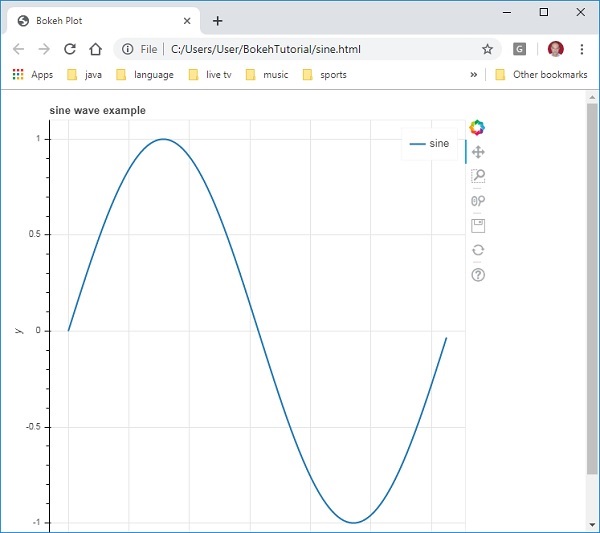
要获取散景图对象,请指定标题以及x和y轴标签,如下所示:
p = figure(title = "sine wave example", x_axis_label = 'x', y_axis_label = 'y')
Figure对象包含一个line()方法,该方法向该图添加线字形。它需要x和y轴的数据系列。
p.line(x, y, legend = "sine", line_width = 2)
最后,设置输出文件并调用show()函数。
output_file("sine.html")
show(p)
这将在’sine.html’中渲染折线图,并将在浏览器中显示。
完整的代码及其输出如下
from bokeh.plotting import figure, output_file, show
import numpy as np
import math
x = np.arange(0, math.pi*2, 0.05)
y = np.sin(x)
output_file("sine.html")
p = figure(title = "sine wave example", x_axis_label = 'x', y_axis_label = 'y')
p.line(x, y, legend = "sine", line_width = 2)
show(p)
在浏览器上输出