📌 相关文章
- 添加和格式化表格Powerpoint 2010(1)
- 添加和格式化表格Powerpoint 2010
- 在Powerpoint 2010中格式化添加的图片(1)
- 在Powerpoint 2010中格式化添加的图片
- 在Powerpoint 2010中添加和格式化SmartArt(1)
- 在Powerpoint 2010中添加和格式化SmartArt
- 在Powerpoint 2010中添加新文本框
- 在Powerpoint 2010中添加新文本框(1)
- 在Powerpoint 2010中添加新幻灯片
- 在Powerpoint 2010中添加新幻灯片(1)
- Powerpoint 2010教程
- Powerpoint 2010教程(1)
- 在Powerpoint 2010中在框中添加文本
- 讨论Powerpoint 2010
- PowerPoint图表不刷新 (1)
- 在Powerpoint 2010中编辑添加的图片
- 在Powerpoint 2010中编辑添加的图片(1)
- 在Powerpoint 2010中添加音频和视频
- 在Powerpoint 2010中添加音频和视频(1)
- 在Powerpoint 2010中编辑添加的形状
- 在Powerpoint 2010中设置背景(1)
- 在Powerpoint 2010中设置背景
- Powerpoint 2010入门(1)
- Powerpoint 2010入门
- 在 Excel 中格式化图表(1)
- 在 Excel 中格式化图表
- Powerpoint 2010中的特殊字符(1)
- Powerpoint 2010中的特殊字符
- 添加和预览动画Powerpoint 2010
📜 在Powerpoint 2010中添加和格式化图表
📅 最后修改于: 2020-11-19 07:45:46 🧑 作者: Mango
图表是表示数据的有效方法。一长串令人困惑的数字可以立即成为趋势,当将它们捕获为图表时可以发现它们。 PowerPoint支持图表的添加和格式设置。
下面给出了将图表添加到PowerPoint中的步骤。
步骤1-转到“插入”功能区下的“插图”组。
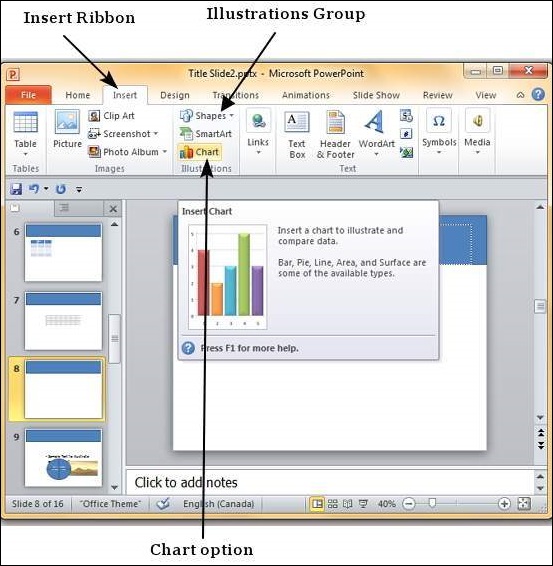
步骤2-单击图表选项以打开“插入图表”对话框。您可以选择图表类别,然后从列表中选择单个图表类型。

步骤3-选择图表类型,然后单击“确定”或双击图表类型以将图表插入幻灯片。
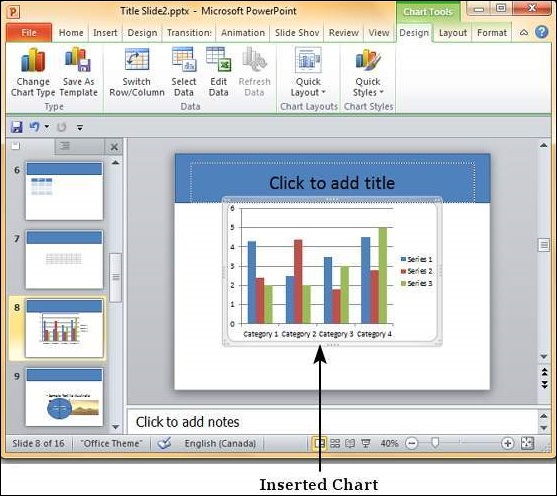
步骤4-与图表一起,还启动了一个Excel电子表格。该电子表格是您的图表的来源。您可以更改类别名称,系列名称和单个值以适合您的需求。

当您在Excel中编辑值和表格时,会相应地修改图表。
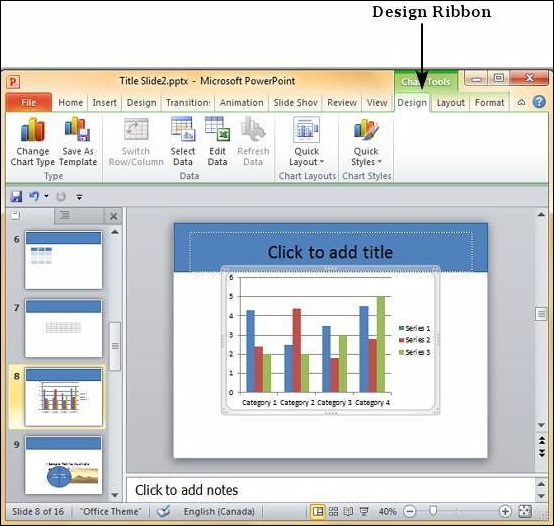
PowerPoint图表格式设置功能分为以下三个功能区:设计,布局和格式。以下各节讨论每个功能区下的功能。要访问这些功能区,必须首先选择图表。
图表设计功能
现在,我们将了解PowerPoint中的各种图表设计功能。
下表给出了各种图表设计功能-
| Feature | Sub Features | Description |
|---|---|---|
| Type | Change Chart Type | Changes the chart type retaining the same data. |
| Save As Template | Saves current chart type as a template. | |
| Data | Switch Row/Column | Transposes current excel data – this is enabled when you have the source data excel sheet open. |
| Select Data | Changes the data range covered in the chart. | |
| Edit Data | Changes the chart source data. | |
| Refresh Data | Refreshes the chart to show the latest data. | |
| Chart Layouts | Chart Layouts | Offers a list of predefined layouts which can be instantly applied to current chart with a single click. |
| Chart Styles | Chart Styles | Offers a list of predefined styles which can be instantly applied to current chart with a single click. |
图表布局功能
现在,我们将了解PowerPoint中的各种图表布局功能。
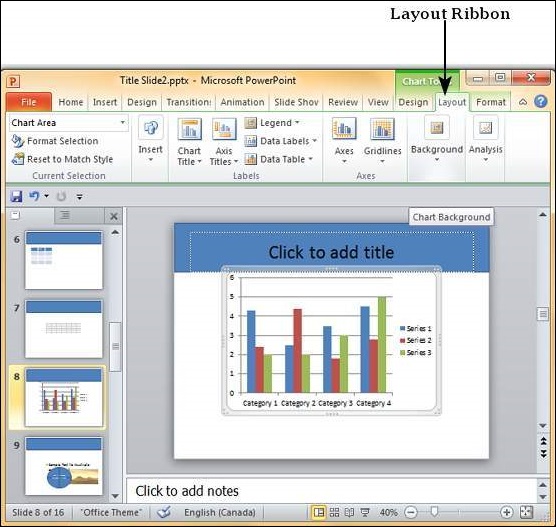
下表描述了PowerPoint中的各种图表布局功能。
| Feature | Sub Features | Description |
|---|---|---|
| Current Selection | Drop down | Shows the currently selected chart element. |
| Format Selection | Shows the selection format dialog to update the selection. | |
| Reset to Match Style | Discards all the chart customizations and matches the chart with the overall presentation theme. | |
| Insert | Picture | Superimposes an image on top of the chart. |
| Shape | Adds a shape to the slide. | |
| Text Box | Adds a text box to the slide. | |
| Labels | Chart Title | Defines the visibility, position and style of the chart title. |
| Axis Titles | Defines the visibility, position and style of the axis titles. | |
| Legend | Defines the visibility and position of the chart legend. | |
| Data Labels | Defines the visibility and position of the data labels. | |
| Data Table | Defines the visibility, position and format of the data table. | |
| Axes | Axes | Defines the position and scale of axes. |
| Gridlines | Defines the visibility and scale of axes. | |
| Background | Plot Area | Toggles chart plot area – available only for 2D charts. |
| Chart Wall | Toggles the chart wall – available only for 3D charts. | |
| Chart Floor | Toggles the chart floor – available only for 3D charts. | |
| 3-D Rotation | Toggles the chart 3D rotation- available only for 3D charts. |
图表格式功能
现在,我们将了解PowerPoint中的各种图表格式功能。
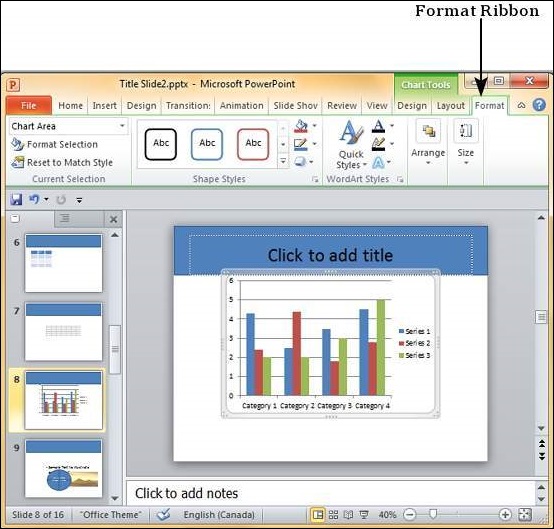
下表介绍了PowerPoint中的各种图表格式功能。
| Feature | Sub Features | Description |
|---|---|---|
| Current Selection | Drop down | Shows the currently selected chart element. |
| Format Selection | Shows the selection format dialog to update the selection. | |
| Reset to Match Style | Discards all the chart customizations and matches the chart with the overall presentation theme. | |
| Shape Styles | Shape Fill | Offers different shades to be added to selected chart series item. You can pick from solid shade, texture, image or gradient shading. |
| Border | Offers different border options for selected chart series item. You can edit the border color, thickness and style. | |
| Effects | Offers the ability to add special effects to selected chart series item. | |
| Word Art Styles | Text Fill | Allows you to change the color of the text within the chart. |
| Text Outline | Allows you to add an outline to the text within the chart and change the outline color, weight and style. | |
| Text Effects | Allows you to add special effects (like reflection, shadow etc.) to the text within the chart. | |
| Quick Styles | Contains a list of pre-defined Word Art styles that can be applied to the selected text within the chart with a single click. | |
| Arrange | Bring Forward | Allows you to move the chart up by one layer or right to the top. |
| Send Backward | Allows you to move the chart down by one layer or right to the bottom of the slide. | |
| Selection Pane | Toggles the Selection and Visibility sidebar. | |
| Align | Allows you to align the entire chart with reference to the slide. | |
| Group | Allows you to group multiple charts as one group object, or split a group object into individual charts. | |
| Size | Height | Allows you to adjust the chart height. |
| Width | Allows you to adjust the chart width. |