Python中的 Matplotlib.ticker.PercentFormatter 类
Matplotlib是Python中用于数组二维图的惊人可视化库。 Matplotlib 是一个基于 NumPy 数组构建的多平台数据可视化库,旨在与更广泛的 SciPy 堆栈配合使用。
matplotlib.ticker.PercentFormatter
matplotlib.ticker.PercentFormatter类用于将数字格式化为百分比。
Syntax: class matplotlib.ticker.PercentFormatter(xmax=100, decimals=None, symbol=’%’, is_latex=False)
Parameters:
- xmax: It is a float value that determines how the number is converted into a percentage.
- decimals: It is either an integer value or None. It determines the number of decimal places to place after the point. If None (the default), the number will be computed automatically.
- symbol : It is either a string or none that gets appended to the label.
- is_latex: It is a boolean value. If False, reserved LaTeX characters in symbol are eliminated.
示例 1:
import pandas as pd
import numpy as np
import matplotlib.ticker as mtick
from matplotlib.ticker import PercentFormatter

df = pd.DataFrame(np.random.randn(100, 5))

ax = df.plot()
ax.yaxis.set_major_formatter(mtick.PercentFormatter(5.0))
输出: 
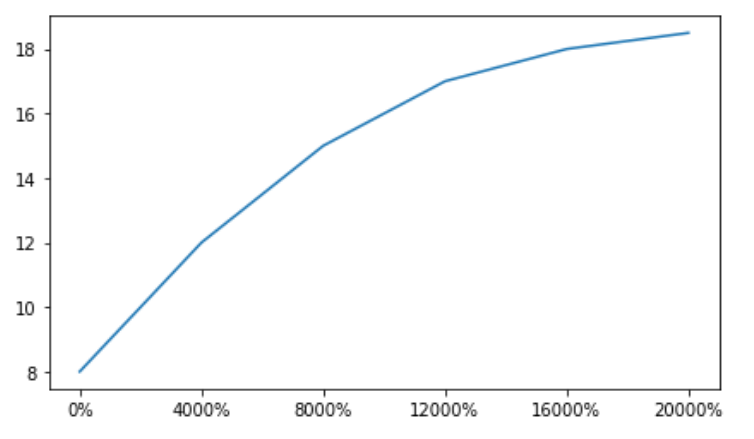
示例 2:
import matplotlib.pyplot as plt
import numpy as np
import matplotlib.ticker as mtick
from matplotlib.ticker import PercentFormatter

data = [8, 12, 15, 17, 18, 18.5]
perc = np.linspace(0, 100, len(data))

fig = plt.figure(1, (7, 4))
ax = fig.add_subplot(1, 1, 1)

ax.plot(perc, data)

xticks = mtick.PercentFormatter(0.5)
ax.xaxis.set_major_formatter(xticks)

plt.show()
输出: 