Python中的 Matplotlib.ticker.IndexFormatter 类
Matplotlib是Python中用于数组二维图的惊人可视化库。 Matplotlib 是一个基于 NumPy 数组构建的多平台数据可视化库,旨在与更广泛的 SciPy 堆栈配合使用。
matplotlib.ticker.IndexFormatter
matplotlib.ticker.IndexFormatter类是matplotlib.ticker类的子类,用于格式化位置 x,它是最近的第 i 个标签,其中 i = int(x + 0.5)。 i len(list) 的位置有 0 个刻度标签。
Syntax: class matplotlib.ticker.IndexFormatter(labels)
Parameter :
- labels: It is a list of labels.
示例 1:
import numpy as np
import matplotlib.pyplot as plt
import matplotlib as mpl


# create dummy data
x = ['str{}'.format(k) for k in range(20)]
y = np.random.rand(len(x))

# create an IndexFormatter
# with labels x
x_fmt = mpl.ticker.IndexFormatter(x)

fig,ax = plt.subplots()

ax.plot(y)

# set our IndexFormatter to be
# responsible for major ticks
ax.xaxis.set_major_formatter(x_fmt)
输出: 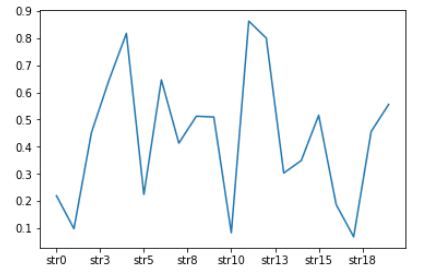
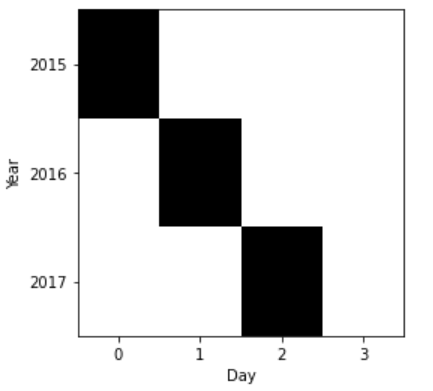
示例 2:
from matplotlib.ticker import IndexFormatter, IndexLocator
import pandas as pd
import matplotlib.pyplot as plt


years = range(2015, 2018)
fields = range(4)
days = range(4)
bands = ['R', 'G', 'B']

index = pd.MultiIndex.from_product(
    [years, fields], names =['year', 'field'])

columns = pd.MultiIndex.from_product(
    [days, bands], names =['day', 'band'])

df = pd.DataFrame(0, index = index, columns = columns)

df.loc[(2015, ), (0, )] = 1
df.loc[(2016, ), (1, )] = 1
df.loc[(2017, ), (2, )] = 1
ax = plt.gca()
plt.spy(df)

xbase = len(bands)
xoffset = xbase / 2
xlabels = df.columns.get_level_values('day')

ax.xaxis.set_major_locator(IndexLocator(base = xbase,
                                        offset = xoffset))

ax.xaxis.set_major_formatter(IndexFormatter(xlabels))

plt.xlabel('Day')
ax.xaxis.tick_bottom()

ybase = len(fields)
yoffset = ybase / 2
ylabels = df.index.get_level_values('year')

ax.yaxis.set_major_locator(IndexLocator(base = ybase,
                                        offset = yoffset))

ax.yaxis.set_major_formatter(IndexFormatter(ylabels))

plt.ylabel('Year')

plt.show()
输出: