Python中的 Matplotlib.ticker.LogFormatter 类
Matplotlib是Python中用于数组二维图的惊人可视化库。 Matplotlib 是一个基于 NumPy 数组构建的多平台数据可视化库,旨在与更广泛的 SciPy 堆栈配合使用。
matplotlib.ticker.LogFormatter
matplotlib.ticker.LogFormatter类用于在 log 或 symlog 尺度上格式化刻度。它要么直接实例化,要么被子类化。
Syntax: class matplotlib.ticker.LogFormatter(base=10.0, labelOnlyBase=False, minor_thresholds=None, linthresh=None)
Parameters:
- base: It is an optional float value for the logarithmic base used for all calculations. By default it is 10.
- labelOnlyBase: It is an optional boolean value which if set to True, the label ticks only at integer powers of base. In general it is True for major ticks and False for minor ticks. By default it is False.
- minor_thresholds: It is an optional tuple of two values(ie, subset, all).If labelOnlyBase is set to False, these two numbers dictate the labeling of ticks which are not at integer powers of the base; generally these are the minor ticks. The log of the axis data range is the controlling parameter.
- linthresh: This parameter must be supplied if a symmetric log scale is being used.
类的方法:
- format_data(self, value):返回值的位置未指定的完整字符串表示形式。
- format_data_short(self, value):它返回一个数字的短格式字符串表示。
- label_minor(self, labelOnlyBase):用于打开或关闭次要刻度标记。
- set_locs(self, locs=None):它使用轴视图控制刻度的标记。
示例 1:
import numpy as np
import matplotlib.pyplot as plt
from matplotlib.ticker import LogFormatterSciNotation


class CustomTicker(LogFormatterSciNotation):

    def __call__(self, x, pos = None):

        if x not in [0.1, 1, 10]:
            return LogFormatterSciNotation.__call__(self, x, pos = None)

        else:
            return "{x:g}".format(x = x)


fig = plt.figure(figsize =[7, 7])
ax = fig.add_subplot(111)

ax.set_yscale('log')
ax.set_xscale('log')

ax.plot(np.logspace(-4, 4), np.logspace(-4, 4))

ax.xaxis.set_major_formatter(CustomTicker())

plt.show()
输出: 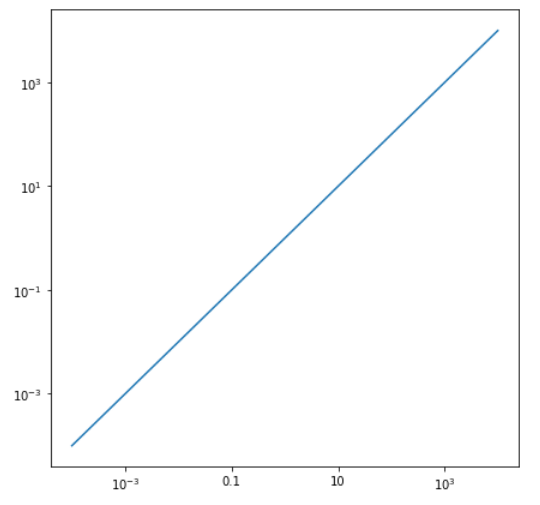
示例 2:
import matplotlib.pyplot as plt
from matplotlib.ticker import LogFormatter
import numpy as np
fig, axes = plt.subplots(4, figsize =(12, 24))
dt = 0.01
t = np.arange(dt, 20.0, dt)
# first plot doesn't use a formatter
axes[0].semilogx(t, np.exp(-t / 5.0))
axes[0].set_xlim([0, 25])
axes[0].grid()
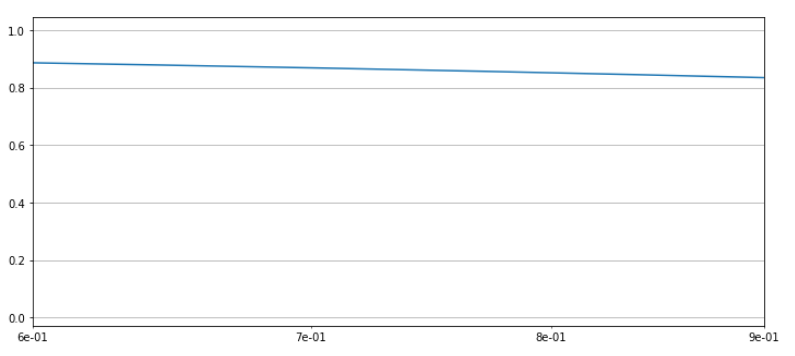
xlims = [[0, 25], [0.2, 8], [0.6, 0.9]]
for ax, xlim in zip(axes[1:], xlims):
ax.semilogx(t, np.exp(-t / 5.0))
formatter = LogFormatter(labelOnlyBase = False,
minor_thresholds = (2, 0.4))
ax.get_xaxis().set_minor_formatter(formatter)
ax.set_xlim(xlim)
ax.grid()
plt.show()
输出: