Python中的 Matplotlib.ticker.LinearLocator 类
Matplotlib是Python中用于数组二维图的惊人可视化库。 Matplotlib 是一个基于 NumPy 数组构建的多平台数据可视化库,旨在与更广泛的 SciPy 堆栈配合使用。
matplotlib.ticker.LinearLocator
matplotlib.ticker.LinearLocator类用于确定刻度位置。在第一次调用时,该函数尝试设置刻度数以进行良好的刻度分区。随着刻度数的固定,交互式导航得到改善。预设参数用于根据lom,设置locs ,lom是vmin, vmax -> locs的字典映射。
Syntax: class matplotlib.ticker.LinearLocator(numticks=None, presets=None)
Parameters:
- numticks: Number of ticks in total.
- presets: It is used to set locs based on lom, which is a dictionary mapping of vmin, vmax -> locs.
类的方法:
- set_params(self, numticks=None, presets=None):用于设置此定位器内的参数。
-
tick_values(self, vmin, vmax):它返回位于 vmin 和 vmax 之间的刻度值。 - view_limits(self, vmin, vmax):用于智能选择视图限制。
示例 1:
import numpy as np
import matplotlib.pyplot as plt
import matplotlib.ticker


xGrid = np.linspace(1-1e-14, 1-1e-16, 30,
                    dtype = np.longdouble)

y = np.random.rand(len(xGrid))

plt.plot(xGrid, y)
plt.xlim(1-1e-14, 1)

loc = matplotlib.ticker.LinearLocator(numticks = 5)
plt.gca().xaxis.set_major_locator(loc)

plt.show()
输出: 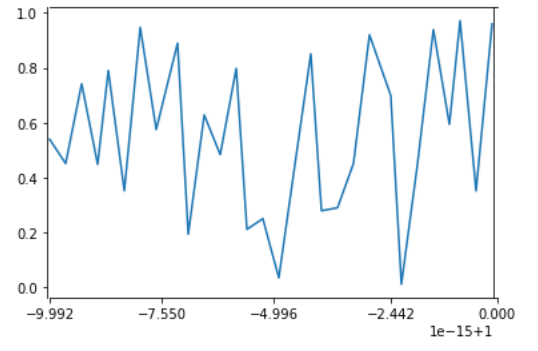
示例 2:
import numpy as np
import matplotlib.pyplot as plt
import matplotlib.ticker as ticker


# Setup a plot such that only the bottom
# spine is shown
def setup(ax):

    ax.spines['right'].set_color('green')
    ax.spines['left'].set_color('red')

    ax.yaxis.set_major_locator(ticker.NullLocator())
    ax.spines['top'].set_color('pink')
    ax.xaxis.set_ticks_position('bottom')

    ax.tick_params(which ='major', width = 1.00)
    ax.tick_params(which ='major', length = 5)
    ax.tick_params(which ='minor', width = 0.75)
    ax.tick_params(which ='minor', length = 2.5)

    ax.set_xlim(0, 5)
    ax.set_ylim(0, 1)
    ax.patch.set_alpha(0.0)

plt.figure(figsize =(8, 6))
n = 8
ax = plt.subplot(n, 1, 4)
setup(ax)
ax.xaxis.set_major_locator(ticker.LinearLocator(3))
ax.xaxis.set_minor_locator(ticker.LinearLocator(31))

ax.text(0.0, 0.1, "LinearLocator",
        fontsize = 14,
        transform = ax.transAxes)

plt.subplots_adjust(left = 0.05,
                    right = 0.95,
                    bottom = 0.05,
                    top = 1.05)

plt.show()
输出: 
在评论中写代码?请使用 ide.geeksforgeeks.org,生成链接并在此处分享链接。