毫升 | Fowlkes-Mallows 分数
Fowlkes-Mallows Score是一种评估指标,用于评估应用不同聚类算法后获得的聚类之间的相似性。虽然在技术上它用于量化两个聚类之间的相似性,但它通常用于通过假设第二个聚类是真实的(即观察到的数据)并假设它是完美聚类来评估聚类算法的聚类性能。
假设数据中有 N 个数据点,聚类 A1 和 A2 中有 k 个聚类。然后建立矩阵 M 使得
![M = [m_{ij}]_{k\times k}](https://mangodoc.oss-cn-beijing.aliyuncs.com/geek8geeks/ML_%7C_Fowlkes-Mallows_Score_0.png "由 QuickLaTeX.com 渲染")
在哪里 确定位于聚类 A1 中的第 i 个聚类和聚类 A2 中的第 j 个聚类中的数据点数。
参数 k 的 Fowlkes-Mallows 指数由下式给出

在哪里

以下术语是在上述符号约定的上下文中定义的:-
- True Positive(TP): A1和A2中同一簇中的数据点对的数量。
- False Positive(FP):在 A1 中在同一簇中但不在 A2 中的数据点对的数量。
- False Negative(FN): A1中不在同一个簇中但在A2中同一个簇的数据点对的数量。
- True Negative(TN):在 A1 和 A2 中不属于同一簇的数据点对的数量。
明显地

因此,Fowlkes-Mallows 指数也可以表示为:-

重写上面的表达式


因此,Fowlkes-Mallows 指数是精度和召回率的几何平均值。
特性:
- 无假设:此评估指标不假设有关集群结构的任何属性,因此证明比传统评估方法具有显着优势。
- 真实规则:此评估指标的一个缺点是它需要了解真实规则(类标签)来评估聚类算法。
以下步骤将演示如何使用 Sklearn 评估聚类算法的 Fowlkes-Mallows 指数。以下步骤的数据集是信用卡欺诈检测数据集,可以从 Kaggle 下载。
第 1 步:导入所需的库
import pandas as pd
import matplotlib.pyplot as plt
from sklearn.cluster import KMeans
from sklearn.metrics import fowlkes_mallows
第 2 步:加载和清理数据
#Changing the working location to the location of the file
cd C:\Users\Dev\Desktop\Kaggle\Credit Card Fraud
#Loading the data
df = pd.read_csv('creditcard.csv')
#Separating the dependent and independent variables
y = df['Class']
X = df.drop('Class',axis=1)
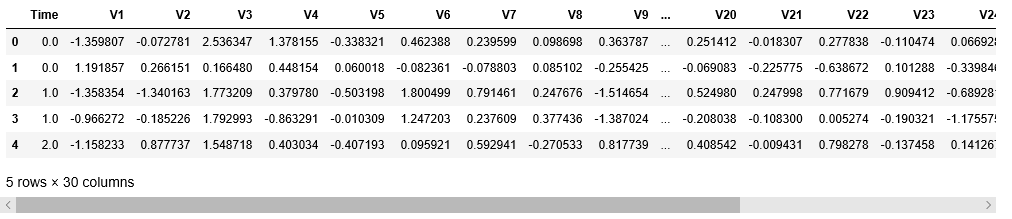
X.head()
第 3 步:构建不同的聚类并评估个人表现
以下代码行涉及构建不同的 K-Means 聚类模型,每个模型具有不同的参数 n_clusters 值,然后使用 Fowlkes-Mallows 分数评估每个单独的性能。
#List of Fowlkes-Mallows Scores for different models
fms_scores = []

#List of different number of clusters
N_Clusters = [2,3,4,5,6]
a) n_clusters = 2
#Building the clustering model
kmeans2 = KMeans(n_clusters=2)

#Training the clustering model
kmeans2.fit(X)

#Storing the predicted Clustering labels
labels2 = kmeans2.predict(X)

#Evaluating the performance
fms_scores.append(fms(y,labels2))
b) n_clusters = 3
#Building the clustering model
kmeans3 = KMeans(n_clusters=3)

#Training the clustering model
kmeans3.fit(X)

#Storing the predicted Clustering labels
labels3 = kmeans3.predict(X)

#Evaluating the performance
fms_scores.append(fms(y,labels3))
c) n_clusters = 4
#Building the clustering model
kmeans4 = KMeans(n_clusters=4)

#Training the clustering model
kmeans4.fit(X)

#Storing the predicted Clustering labels
labels4 = kmeans4.predict(X)

#Evaluating the performance
fms_scores.append(fms(y,labels4))
d) n_clusters = 5
#Building the clustering model
kmeans5 = KMeans(n_clusters=5)

#Training the clustering model
kmeans5.fit(X)

#Storing the predicted Clustering labels
labels5 = kmeans5.predict(X)

#Evaluating the performance
fms_scores.append(fms(y,labels5))
e) n_clusters = 6
#Building the clustering model
kmeans6 = KMeans(n_clusters=6)

#Training the clustering model
kmeans6.fit(X)

#Storing the predicted Clustering labels
labels6 = kmeans6.predict(X)

#Evaluating the performance
fms_scores.append(fms(y,labels6))
print(fms_scores)
![]()
第 4 步:可视化和比较结果
#Plotting a Bar Graph to compare the models
plt.bar(N_Clusters,fms_scores)
plt.xlabel('Number of Clusters')
plt.ylabel('Fowlkes Mallows Score')
plt.title('Comparison of different Clustering Models')
plt.show()

因此,很明显,聚类数 = 2 的聚类与观察到的数据最相似,因为数据只有两个类标签。