使用Python将协方差矩阵转换为相关矩阵
在本文中,我们将讨论 Covariance 和 Correlation 之间的关系,并使用Python我们自己的函数来计算协方差和相关性。
协方差:
它告诉我们两个量是如何相互关联的,比如我们要计算 x 和 y 之间的协方差,那么结果可以是其中之一。
在哪里
分别是x和y的均值。
解释输出:
Either the covariance between x and y is :
Covariance(x,y) > 0 : this means that they are positively related
Covariance(x,y) < 0 : this means that x and y are negatively related
if Covariance(x,y) = 0 : then x and y are independent of each other.
协方差矩阵:
协方差提供了两个变量或多组变量之间相关强度的度量,要计算协方差矩阵,使用numpy中的cov()方法。
句法:
ny.cov(m, y=None, rowvar=True, bias=False, ddof=None, fweights=None, aweights=None)
m : [array_like] A 1D or 2D variables. variables are columns
y : [array_like] It has the same form as that of m.
rowvar : [bool, optional] If rowvar is True (default), then each row represents a variable, with observations in the columns. Otherwise, the relationship is transposed:
bias : Default normalization is False. If bias is True it normalize the data points.
ddof : If not None the default value implied by bias is overridden. Note that ddof=1 will return the unbiased estimate, even if both fweights and aweights are specified.
fweights : fweight is 1-D array of integer frequency weights
aweights : aweight is 1-D array of observation vector weights.
Returns: It returns ndarray covariance matrix
相关性:
它显示变量对是否以及如何相互关联。相关性取-1到+1之间的值,其中接近+1的值表示强正相关,接近-1的值表示强负相关。它给出了变量之间关系的方向和强度。
相关矩阵:
它 基本上是一个协方差矩阵。也称为自协方差矩阵、离散矩阵、方差矩阵或方差-协方差矩阵。它是一个矩阵,其中 ij 位置定义给定数据集的第i个和第j个参数之间的相关性。它是使用numpy的corrcoeff()方法计算的。
句法:
numpy.corrcoef(x, y=None, rowvar=True, bias=
x : A 1-D or 2-D array containing multiple variables and observations. Each row of x represents a variable, and each column a single observation of all those variables. Also see rowvar below.
y, optional: An additional set of variables and observations. y has the same shape as x.
rowvar : If rowvar is True (default), then each row represents a variable, with observations in the columns. Otherwise, the relationship is transposed: each column represents a variable, while the rows contain observations.
Returns: ndarray
那么为什么我们需要 Correlation 呢?
- 协方差告诉我们两个随机变量是 +ve 还是 -ve 相关,它不会告诉我们相关程度。
- 协方差是算术变化的变体,例如:如果我们将 x 乘以 10 或除以 10,那么结果将发生变化,这对于相关性而言并非如此,因为此类运算的结果保持不变。
- 协方差的输出很难比较,因为值的范围可以从 - 无穷大到 + 无穷大。而相关的输出值范围从 0 到 1。
相关性和协方差之间的关系
相关性只是归一化的协方差,参考下面的公式。
在哪里
分别是 x 和 y 的标准差。
Python程序将协方差矩阵转换为相关矩阵
为了解决这个问题,我们选择了 iris 数据,因为为了计算协方差,我们需要数据,如果我们使用真实单词示例数据集会更好。
加载和显示数据集
Python3
import numpy as np
import pandas as pd

# loading in the iris dataset for demo purposes

dataset = pd.read_csv("iris.csv")

dataset.head()
Python3
data = dataset.iloc[:, :-1].valuesPython3
# calculates the covariance between x and y
def calcCov(x, y):

    mean_x, mean_y = x.mean(), y.mean()
    n = len(x)

    return sum((x - mean_x) * (y - mean_y)) / n


# calculates the Covariance matrix
def covMat(data):

    # get the rows and cols
    rows, cols = data.shape

    # the covariance matroix has a shape of n_features x n_features
    # n_featurs  = cols - 1 (not including the target column)
    cov_mat = np.zeros((cols, cols))

    for i in range(cols):

        for j in range(cols):
            # store the value in the matrix
            cov_mat[i][j] = calcCov(data[:, i], data[:, j])

    return cov_mat

  covMat(data)
Python3
np.cov(data,rowvar=False)Python3
# Now calculating Correlation using our Covariance function (covMat())


def corrMat(data):

    rows, cols = data.shape

    corr_mat = np.zeros((cols, cols))

    for i in range(cols):

        for j in range(cols):

            x, y = data[:, i], data[:, j]
            # not here that we are just normalizing the covariance matrix
            corr_mat[i][j] = calcCov(x, y) / (x.std() * y.std())

    return corr_mat
  corrMat(data)
Python3
np.corrcoef(data,rowvar=False)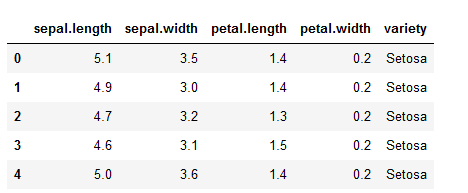
在这个例子中,我们不会使用目标列
蟒蛇3
data = dataset.iloc[:, :-1].values
实现协方差矩阵的程序:
蟒蛇3
# calculates the covariance between x and y
def calcCov(x, y):

    mean_x, mean_y = x.mean(), y.mean()
    n = len(x)

    return sum((x - mean_x) * (y - mean_y)) / n


# calculates the Covariance matrix
def covMat(data):

    # get the rows and cols
    rows, cols = data.shape

    # the covariance matroix has a shape of n_features x n_features
    # n_featurs  = cols - 1 (not including the target column)
    cov_mat = np.zeros((cols, cols))

    for i in range(cols):

        for j in range(cols):
            # store the value in the matrix
            cov_mat[i][j] = calcCov(data[:, i], data[:, j])

    return cov_mat

  covMat(data)
输出:
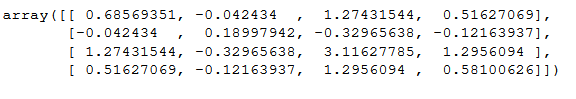
Numpy cov()输出:
蟒蛇3
np.cov(data,rowvar=False)
注意:rowVars 需要设为 false,否则它将行作为特征、列和观察值。
输出:

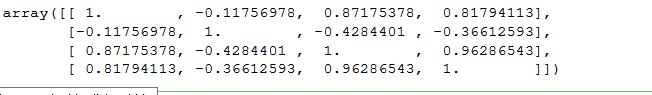
计算相关性:
在这个函数中,我们将把协方差矩阵转换为相关性。
蟒蛇3
# Now calculating Correlation using our Covariance function (covMat())


def corrMat(data):

    rows, cols = data.shape

    corr_mat = np.zeros((cols, cols))

    for i in range(cols):

        for j in range(cols):

            x, y = data[:, i], data[:, j]
            # not here that we are just normalizing the covariance matrix
            corr_mat[i][j] = calcCov(x, y) / (x.std() * y.std())

    return corr_mat
  corrMat(data)
输出:
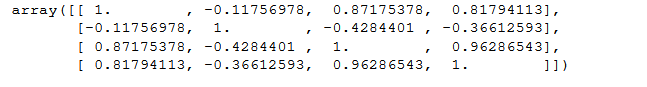
corrcoef() 在numpy中也可用于计算相关性。
蟒蛇3
np.corrcoef(data,rowvar=False)
输出: