使用Python创建相关矩阵
相关矩阵是包含变量之间相关系数的表格。表中的每个单元格代表两个变量之间的相关性。该值介于 -1 和 1 之间。相关矩阵用于汇总数据,作为高级分析的诊断和更高级分析的输入。相关性的两个关键组成部分是:
- 幅度:幅度越大,相关性越强。
- 符号:如果为正,则存在规则相关性。如果为负,则存在负相关。
使用以下两个库创建了相关矩阵:
- Numpy 库
- 熊猫图书馆
方法 1:使用 Numpy 库创建相关矩阵
Numpy 库使用 corrcoef()函数返回一个 2×2 的矩阵。该矩阵由 x 与 x (0,0)、x 与 y (0,1)、y 与 x (1,0) 以及 y 与 y (1,1) 的相关性组成。我们只关心 x 与 y 的相关性,即单元格 (0,1) 或 (1,0)。请参阅下面的示例。
示例 1:假设一家冰淇淋店跟踪当天冰淇淋的总销售额与温度的关系。
Python3
import numpy as np


# x represents the total sale in
# dollers
x = [215, 325, 185, 332, 406, 522, 412,
     614, 544, 421, 445, 408],

# y represents the temperature on
# each day of sale
y = [14.2, 16.4, 11.9, 15.2, 18.5, 22.1,
     19.4, 25.1, 23.4, 18.1, 22.6, 17.2]

# create correlation matrix
matrix = np.corrcoef(x, y)

# print matrix
print(matrix)
Python3
import numpy as np


# x represents the age
x = [43, 21, 25, 42, 57, 59]

# y represents the glucose level
# corresponding to that age
y = [99, 65, 79, 75, 87, 81]

# correlation matrix
matrix = np.corrcoef(x, y)
print(matrix)
Python3
import pandas as pd


# collect data
data = {
    'x': [45, 37, 42, 35, 39],
    'y': [38, 31, 26, 28, 33],
    'z': [10, 15, 17, 21, 12]
}

# form dataframe
dataframe = pd.DataFrame(data, columns=['x', 'y', 'z'])
print("Dataframe is : ")
print(dataframe)

# form correlation matrix
matrix = dataframe.corr()
print("Correlation matrix is : ")
print(matrix)
Python3
import pandas as pd


# create dataframe from file
dataframe = pd.read_csv("C:\\GFG\\sample.csv")

# show dataframe
print(dataframe)

# use corr() method on dataframe to
# make correlation matrix
matrix = dataframe.corr()

# print correlation matrix
print("Correlation Matrix is : ")
print(matrix)
输出
[[1.         0.95750662]
 [0.95750662 1.        ]]
从上面的矩阵中,如果我们看到单元格 (0,1) 和 (1,0) 都具有等于 0.95750662 的相同值,这使我们得出结论,只要温度高,我们就会有更多的销售额。
示例 2:假设我们给出了男孩的血糖水平与年龄相应。找出年龄(x)和身体(y)中葡萄糖水平之间的相关性。
蟒蛇3
import numpy as np


# x represents the age
x = [43, 21, 25, 42, 57, 59]

# y represents the glucose level
# corresponding to that age
y = [99, 65, 79, 75, 87, 81]

# correlation matrix
matrix = np.corrcoef(x, y)
print(matrix)
输出
[[1.        0.5298089]
 [0.5298089 1.       ]]
从上述相关矩阵中,0.5298089 或 52.98% 表示该变量具有中度正相关。
方法 2:使用 Pandas 库创建相关矩阵
为了为给定的数据集创建相关矩阵,我们在数据帧上使用 corr() 方法。
示例 1:
蟒蛇3
import pandas as pd


# collect data
data = {
    'x': [45, 37, 42, 35, 39],
    'y': [38, 31, 26, 28, 33],
    'z': [10, 15, 17, 21, 12]
}

# form dataframe
dataframe = pd.DataFrame(data, columns=['x', 'y', 'z'])
print("Dataframe is : ")
print(dataframe)

# form correlation matrix
matrix = dataframe.corr()
print("Correlation matrix is : ")
print(matrix)
输出:
Dataframe is :
    x   y   z
0  45  38  10
1  37  31  15
2  42  26  17
3  35  28  21
4  39  33  12
Correlation matrix is :
          x         y         z
x  1.000000  0.518457 -0.701886
y  0.518457  1.000000 -0.860941
z -0.701886 -0.860941  1.000000
示例 2:
使用的 CSV 文件:
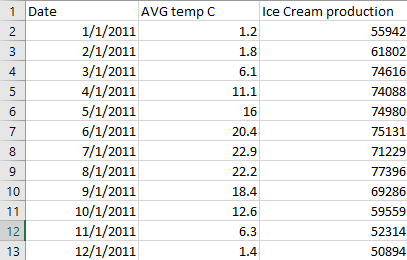
蟒蛇3
import pandas as pd


# create dataframe from file
dataframe = pd.read_csv("C:\\GFG\\sample.csv")

# show dataframe
print(dataframe)

# use corr() method on dataframe to
# make correlation matrix
matrix = dataframe.corr()

# print correlation matrix
print("Correlation Matrix is : ")
print(matrix)
输出:
Correlation Matrix is :
                     AVG temp C  Ice Cream production
AVG temp C              1.000000              0.718032
Ice Cream production    0.718032              1.000000