更改 Matplotlib 图形的 x 或 y 刻度
Matplotlib是Python中的绘图库,用于可视化数据,受 MATLAB 启发,这意味着所使用的术语(轴、图形、绘图)将类似于 MATLAB 中使用的术语。 Pyplot是 Matplotlib 库中的一个模块,它是 Matplotlib 模块的类外壳接口。
有多种方法可以更改 Matplotlib 绘图轴的刻度间隔。其中一些最简单的在这里讨论。
方法 1: xticks() 和 yticks()
xticks()和yticks()函数接受一个列表对象作为参数。列表中的元素表示相应动作的位置,其中将显示刻度。我们还可以使用这些函数设置轴刻度的标签,但是,这里我们将只关注更改轴刻度的间隔。要了解有关这些函数的更多信息,请单击 xticks() 和 yticks()。
句法 :
For x-axis : matplotlib.pyplot.xticks()
For y-axis : matplotlib.pyplot.yticks()
要创建刻度列表,我们将使用 numpy.arange(start, stop, step),其中 start 作为刻度的起始值,stop 作为不包含的结束值,step 作为刻度之间的整数空间。
下面的例子说明了 matplotlib.pyplot.xticks() 和 matplotlib.pyplot.yticks() 方法:
例子 :
Python3
#  Code to change the interval of ticks of axes using xticks() and yticks()

# Importing libraries
import matplotlib.pyplot as plt
import numpy as np

#Creating x-value and y-value of data
x = [5, 10, 15, 20]
y = [10, 20, 30, 40]

# Plotting the data
plt.plot(x, y)

# Setting the interval of ticks of x-axis to 5.
listOf_Xticks = np.arange(0, 25, 5)
plt.xticks(listOf_Xticks)

# Setting the interval of ticks of y-axis to 10.
listOf_Yticks = np.arange(0, 50, 10)
plt.yticks(listOf_Yticks)

# Giving title to the plot
plt.title('matplotlib.pyplot.xticks() and matplotlib.pyplot.yticks() Example')

plt.show()
Python3
#  Code to change the interval of ticks of axes
# using set_ticks() method

# Importing libraries
import matplotlib.pyplot as plt
import numpy as np

# Creating x-value and y-value of data
x = [1, 2, 3, 4]
y = [0.1, 0.2, 0.3, 0.4]

# Creating a sublpot with 2 row and 1 column
fig, (axes1, axes2) = plt.subplots(2, 1)

# Plotting first axes object i.e. axes1 and labeling
# its x and y axes
axes1.plot(x, y)
axes1.set_ylabel('y-axis')
axes1.set_xlabel('x-axis')

# Setting the interval of ticks of x-axis to 1 and of y-axis
# to 0.1 of first axes i.e. axes1.
axes1.xaxis.set_ticks(np.arange(0, 5, 1))
axes1.yaxis.set_ticks(np.arange(0, 0.5, 0.1))

# Plotting first axes object i.e. axes1 and labeling its
# x and y axes
axes2.plot(x, y)
axes2.set_ylabel('y-axis')
axes2.set_xlabel('x-axis')

# Setting the interval of ticks of x-axis to 0.5 and
# of y-axis to 0.05 of second axes i.e. axes2.
axes2.xaxis.set_ticks(np.arange(0, 4.5, 0.5))
axes2.yaxis.set_ticks(np.arange(0, 0.45, 0.05))


# Giving title to the figure object i.e. fig
fig.suptitle('set_ticks() Example')
fig.tight_layout(pad=3.0)

plt.show()
Python3
#  Code to change the interval of ticks of axes
# using set_xticks() and set_yticks() methods

# Importing libraries
import matplotlib.pyplot as plt
import numpy as np

#Creating x-value and y-value of data
x = [1, 2, 3, 4]
y = [0.1, 0.2, 0.3, 0.4]

# Creating a sublpot with 2 row and 1 column
fig, (axes1, axes2) = plt.subplots(2, 1)

# Plotting first axes object i.e. axes1 and
# labeling its x and y axes
axes1.plot(x, y)
axes1.set_ylabel('y-axis')
axes1.set_xlabel('x-axis')

# Setting the interval of ticks of x-axis to 1 and of
# y-axis to 0.1 of first axes i.e. axes1.
axes1.set_xticks(np.arange(0, 5, 1))
axes1.set_yticks(np.arange(0, 0.5, 0.1))

# Plotting first axes object i.e. axes1 and labeling
# its x and y axes
axes2.plot(x, y)
axes2.set_ylabel('y-axis')
axes2.set_xlabel('x-axis')

# Setting the interval of ticks of x-axis to 0.5 and
# of y-axis to 0.05 of second axes i.e. axes2.
axes2.set_xticks(np.arange(0, 4.5, 0.5))
axes2.set_yticks(np.arange(0, 0.45, 0.05))


#Giving title to the figure object i.e. fig
fig.suptitle('set_xticks() and set_yticks() Example')
fig.tight_layout(pad=3.0)

plt.show()
输出 :
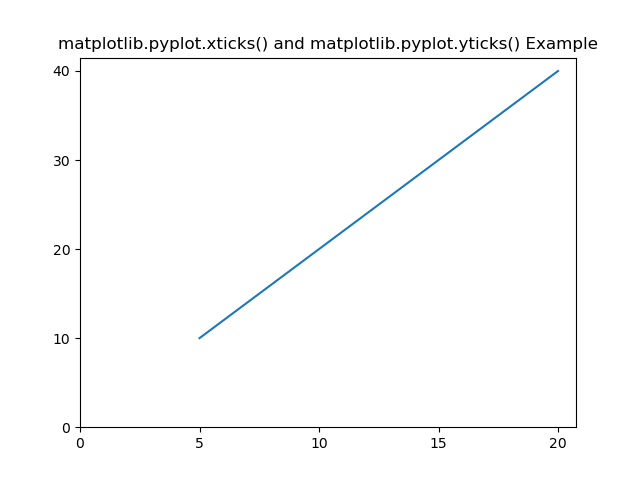
在这里我们可以看到 x 轴上的刻度范围是 [0, 25),间隔为 5,y 轴上的刻度范围是 [0, 50),间隔为 10。这是我们设置的np.arange() 的参数。
注意:上述函数(即 xticks() 和 yticks())不适用于 AxesSubplot 对象。为此,以下方法将起作用。
方法二:set_ticks()
与上述方法类似, set_ticks()也将一个列表对象作为参数,其元素表示刻度在轴上的位置。
句法 :
For x-axis :
AxesSubplot.xaxis.set_ticks()
For y-axis :
AxesSubplot.yaxis.set_ticks()
注意:此方法不适用于 matplotlib.pyplot 对象。
下面的示例说明了 AxesSubplot.xaxis.set_ticks() 和 AxesSubplot.yaxis.set_ticks() 方法:
例子 :
蟒蛇3
#  Code to change the interval of ticks of axes
# using set_ticks() method

# Importing libraries
import matplotlib.pyplot as plt
import numpy as np

# Creating x-value and y-value of data
x = [1, 2, 3, 4]
y = [0.1, 0.2, 0.3, 0.4]

# Creating a sublpot with 2 row and 1 column
fig, (axes1, axes2) = plt.subplots(2, 1)

# Plotting first axes object i.e. axes1 and labeling
# its x and y axes
axes1.plot(x, y)
axes1.set_ylabel('y-axis')
axes1.set_xlabel('x-axis')

# Setting the interval of ticks of x-axis to 1 and of y-axis
# to 0.1 of first axes i.e. axes1.
axes1.xaxis.set_ticks(np.arange(0, 5, 1))
axes1.yaxis.set_ticks(np.arange(0, 0.5, 0.1))

# Plotting first axes object i.e. axes1 and labeling its
# x and y axes
axes2.plot(x, y)
axes2.set_ylabel('y-axis')
axes2.set_xlabel('x-axis')

# Setting the interval of ticks of x-axis to 0.5 and
# of y-axis to 0.05 of second axes i.e. axes2.
axes2.xaxis.set_ticks(np.arange(0, 4.5, 0.5))
axes2.yaxis.set_ticks(np.arange(0, 0.45, 0.05))


# Giving title to the figure object i.e. fig
fig.suptitle('set_ticks() Example')
fig.tight_layout(pad=3.0)

plt.show()
输出 :

方法 3:set_xticks() 和 set_yticks()
set_xticks()和set_yticks()函数将列表对象作为参数。列表中的元素表示相应动作的位置,其中将显示刻度。
句法 :
For x-axis :
AxesSubplot.set_xticks()
For y-axis :
AxesSubplot.set_yticks()
注意:此方法不适用于 matplotlib.pyplot 对象。
下面的示例说明了 AxesSubplot.set_xticks() 和 AxesSubplot.set_yticks() 方法:
例子 :
蟒蛇3
#  Code to change the interval of ticks of axes
# using set_xticks() and set_yticks() methods

# Importing libraries
import matplotlib.pyplot as plt
import numpy as np

#Creating x-value and y-value of data
x = [1, 2, 3, 4]
y = [0.1, 0.2, 0.3, 0.4]

# Creating a sublpot with 2 row and 1 column
fig, (axes1, axes2) = plt.subplots(2, 1)

# Plotting first axes object i.e. axes1 and
# labeling its x and y axes
axes1.plot(x, y)
axes1.set_ylabel('y-axis')
axes1.set_xlabel('x-axis')

# Setting the interval of ticks of x-axis to 1 and of
# y-axis to 0.1 of first axes i.e. axes1.
axes1.set_xticks(np.arange(0, 5, 1))
axes1.set_yticks(np.arange(0, 0.5, 0.1))

# Plotting first axes object i.e. axes1 and labeling
# its x and y axes
axes2.plot(x, y)
axes2.set_ylabel('y-axis')
axes2.set_xlabel('x-axis')

# Setting the interval of ticks of x-axis to 0.5 and
# of y-axis to 0.05 of second axes i.e. axes2.
axes2.set_xticks(np.arange(0, 4.5, 0.5))
axes2.set_yticks(np.arange(0, 0.45, 0.05))


#Giving title to the figure object i.e. fig
fig.suptitle('set_xticks() and set_yticks() Example')
fig.tight_layout(pad=3.0)

plt.show()
输出 :
