R 编程中的决策树分类器
分类是使用类的属性将几个类别的对象分类到各自的类中的任务。分类模型通常用于,
- 预测新的未标记数据对象的类标签
- 提供一个描述性模型,解释每个类中对象的特征
有各种类型的分类技术,例如,
- 逻辑回归
- 决策树
- K-最近邻
- 朴素贝叶斯分类器
- 支持向量机 (SVM)
- 随机森林分类
R 编程中的决策树分类器
决策树是一种类似流程图的树结构,其中内部节点代表特征(或属性),分支代表决策规则,每个叶节点代表结果。决策树包括:
- 节点:测试某个属性的值。
- Edges/Branch:代表一个决策规则并连接到下一个节点。
- 叶节点:代表类标签或类分布的终端节点。

并且这个算法可以很容易地用 R 语言实现。关于决策树分类器的一些要点是,
- 更易解释
- 自动处理决策
- 将空间分成更小的空间
- 容易过拟合
- 可以在小型训练集上进行训练
- 主要受噪音影响
R中的实现
数据集:
一个 400 人的样本人口与一家产品公司分享了他们的年龄、性别和薪水,以及他们是否购买了该产品(0 表示不,1 表示是)。下载数据集 Advertisement.csv。
R
# Importing the dataset
dataset = read.csv('Advertisement.csv')
head(dataset, 10)
R
# Encoding the target feature as factor
dataset$Purchased = factor(dataset$Purchased,
                           levels = c(0, 1))

# Splitting the dataset into
# the Training set and Test set
# install.packages('caTools')
library(caTools)
set.seed(123)
split = sample.split(dataset$Purchased,
                     SplitRatio = 0.75)
training_set = subset(dataset, split == TRUE)
test_set = subset(dataset, split == FALSE)

# Feature Scaling
training_set[-3] = scale(training_set[-3])
test_set[-3] = scale(test_set[-3])

# Fitting Decision Tree Classification
# to the Training set
# install.packages('rpart')
library(rpart)
classifier = rpart(formula = Purchased ~ .,
                   data = training_set)

# Predicting the Test set results
y_pred = predict(classifier,
                 newdata = test_set[-3],
                 type = 'class')

# Making the Confusion Matrix
cm = table(test_set[, 3], y_pred)
R
# Visualising the Training set results
# Install ElemStatLearn if not present
# in the packages using(without hashtag)
# install.packages('ElemStatLearn')
library(ElemStatLearn)
set = training_set

# Building a grid of Age Column(X1)
# and Estimated Salary(X2) Column
X1 = seq(min(set[, 1]) - 1,
         max(set[, 1]) + 1,
         by = 0.01)
X2 = seq(min(set[, 2]) - 1,
         max(set[, 2]) + 1,
         by = 0.01)
grid_set = expand.grid(X1, X2)

# Give name to the columns of matrix
colnames(grid_set) = c('Age',
                       'EstimatedSalary')

# Predicting the values and plotting them
# to grid and labelling the axes
y_grid = predict(classifier,
                 newdata = grid_set,
                 type = 'class')
plot(set[, -3],
     main = 'Decision Tree
             Classification (Training set)',
     xlab = 'Age', ylab = 'Estimated Salary',
     xlim = range(X1), ylim = range(X2))
contour(X1, X2, matrix(as.numeric(y_grid),
                       length(X1),
                       length(X2)),
                       add = TRUE)
points(grid_set, pch = '.',
       col = ifelse(y_grid == 1,
                    'springgreen3',
                    'tomato'))
points(set, pch = 21, bg = ifelse(set[, 3] == 1,
                                  'green4',
                                  'red3'))
R
# Visualising the Test set results
library(ElemStatLearn)
set = test_set

# Building a grid of Age Column(X1)
# and Estimated Salary(X2) Column
X1 = seq(min(set[, 1]) - 1,
         max(set[, 1]) + 1,
         by = 0.01)
X2 = seq(min(set[, 2]) - 1,
         max(set[, 2]) + 1,
         by = 0.01)
grid_set = expand.grid(X1, X2)

# Give name to the columns of matrix
colnames(grid_set) = c('Age',
                       'EstimatedSalary')

# Predicting the values and plotting them
# to grid and labelling the axes
y_grid = predict(classifier,
                 newdata = grid_set,
                 type = 'class')
plot(set[, -3], main = 'Decision Tree
                        Classification (Test set)',
     xlab = 'Age', ylab = 'Estimated Salary',
     xlim = range(X1), ylim = range(X2))
contour(X1, X2, matrix(as.numeric(y_grid),
                       length(X1),
                       length(X2)),
                       add = TRUE)
points(grid_set, pch = '.',
       col = ifelse(y_grid == 1,
                    'springgreen3',
                    'tomato'))
points(set, pch = 21, bg = ifelse(set[, 3] == 1,
                                  'green4',
                                  'red3'))
R
# Plotting the tree
plot(classifier)
text(classifier)
输出: User ID Gender Age EstimatedSalary Purchased 0 15624510 Male 19 19000 0 1 15810944 Male 35 20000 0 2 15668575 Female 26 43000 0 3 15603246 Female 27 57000 0 4 15804002 Male 19 76000 0 5 15728773 Male 27 58000 0 6 15598044 Female 27 84000 0 7 15694829 Female 32 150000 1 8 15600575 Male 25 33000 0 9 15727311 Female 35 65000 0
训练数据
为了训练数据,我们将数据集拆分为测试集,然后使用 rpart 包制作决策树分类器。
R
# Encoding the target feature as factor
dataset$Purchased = factor(dataset$Purchased,
                           levels = c(0, 1))

# Splitting the dataset into
# the Training set and Test set
# install.packages('caTools')
library(caTools)
set.seed(123)
split = sample.split(dataset$Purchased,
                     SplitRatio = 0.75)
training_set = subset(dataset, split == TRUE)
test_set = subset(dataset, split == FALSE)

# Feature Scaling
training_set[-3] = scale(training_set[-3])
test_set[-3] = scale(test_set[-3])

# Fitting Decision Tree Classification
# to the Training set
# install.packages('rpart')
library(rpart)
classifier = rpart(formula = Purchased ~ .,
                   data = training_set)

# Predicting the Test set results
y_pred = predict(classifier,
                 newdata = test_set[-3],
                 type = 'class')

# Making the Confusion Matrix
cm = table(test_set[, 3], y_pred)
- 训练集包含 300 个条目。
- 测试集包含 100 个条目。
Confusion Matrix:
[[62, 6],
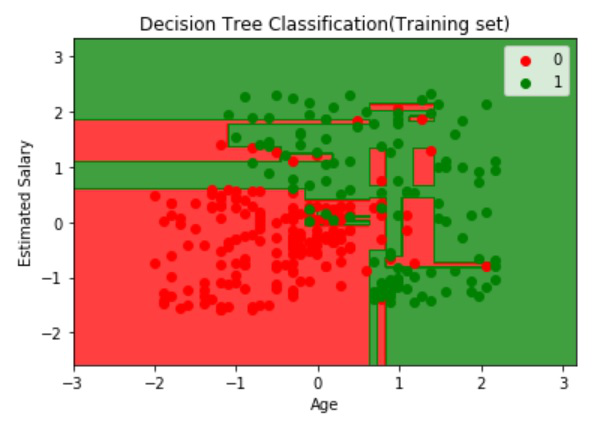
[ 3, 29]]可视化训练数据:
R
# Visualising the Training set results
# Install ElemStatLearn if not present
# in the packages using(without hashtag)
# install.packages('ElemStatLearn')
library(ElemStatLearn)
set = training_set

# Building a grid of Age Column(X1)
# and Estimated Salary(X2) Column
X1 = seq(min(set[, 1]) - 1,
         max(set[, 1]) + 1,
         by = 0.01)
X2 = seq(min(set[, 2]) - 1,
         max(set[, 2]) + 1,
         by = 0.01)
grid_set = expand.grid(X1, X2)

# Give name to the columns of matrix
colnames(grid_set) = c('Age',
                       'EstimatedSalary')

# Predicting the values and plotting them
# to grid and labelling the axes
y_grid = predict(classifier,
                 newdata = grid_set,
                 type = 'class')
plot(set[, -3],
     main = 'Decision Tree
             Classification (Training set)',
     xlab = 'Age', ylab = 'Estimated Salary',
     xlim = range(X1), ylim = range(X2))
contour(X1, X2, matrix(as.numeric(y_grid),
                       length(X1),
                       length(X2)),
                       add = TRUE)
points(grid_set, pch = '.',
       col = ifelse(y_grid == 1,
                    'springgreen3',
                    'tomato'))
points(set, pch = 21, bg = ifelse(set[, 3] == 1,
                                  'green4',
                                  'red3'))
输出:
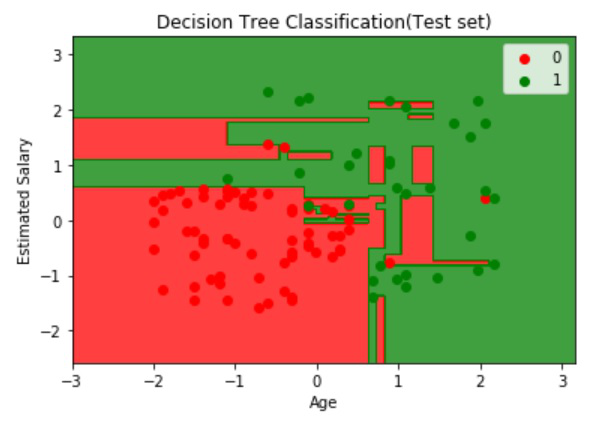
可视化测试数据:
R
# Visualising the Test set results
library(ElemStatLearn)
set = test_set

# Building a grid of Age Column(X1)
# and Estimated Salary(X2) Column
X1 = seq(min(set[, 1]) - 1,
         max(set[, 1]) + 1,
         by = 0.01)
X2 = seq(min(set[, 2]) - 1,
         max(set[, 2]) + 1,
         by = 0.01)
grid_set = expand.grid(X1, X2)

# Give name to the columns of matrix
colnames(grid_set) = c('Age',
                       'EstimatedSalary')

# Predicting the values and plotting them
# to grid and labelling the axes
y_grid = predict(classifier,
                 newdata = grid_set,
                 type = 'class')
plot(set[, -3], main = 'Decision Tree
                        Classification (Test set)',
     xlab = 'Age', ylab = 'Estimated Salary',
     xlim = range(X1), ylim = range(X2))
contour(X1, X2, matrix(as.numeric(y_grid),
                       length(X1),
                       length(X2)),
                       add = TRUE)
points(grid_set, pch = '.',
       col = ifelse(y_grid == 1,
                    'springgreen3',
                    'tomato'))
points(set, pch = 21, bg = ifelse(set[, 3] == 1,
                                  'green4',
                                  'red3'))
输出:
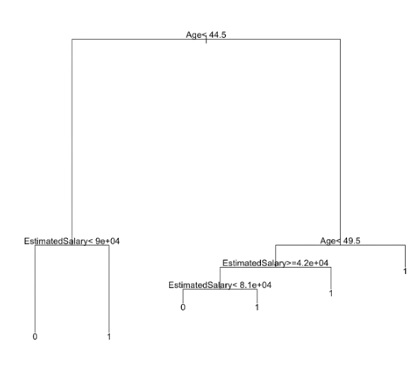
决策树图:
R
# Plotting the tree
plot(classifier)
text(classifier)
输出: