使用 Seaborn 制作带有数据点的 Violinplot
小提琴情节扮演类似的活动,通过须线或箱线图进行。因为它显示了一个或多个分类变量的多个定量数据。在多个单元显示多个数据可能是一种有效且有吸引力的方式。 “宽格式”数据框有助于维护可以绘制在图形上的每个数字列。可以使用 NumPy 或Python对象,但最好使用 Pandas 对象,因为关联的名称将用于注释轴。
在本文中,我们将看到如何制作 Violinplot 和绘制数据点。
方法 1#:使用 violinplot 的内部属性
示例 1:创建 violinplot 并使用内部属性。小提琴内部数据点的内部表示,如果点或棒,显示每个基础数据点。
Syntax: seaborn.violinplot( x, y, data, inner = “points”)
Python3
# Python program to illustrate
# violinplot using inbuilt data-set
# given in seaborn

# importing the required module
import seaborn

# use to set style of background of plot
seaborn.set(style = 'whitegrid')

# loading data-set
tip = seaborn.load_dataset('tips')
plt.figure(figsize=(4,7))

seaborn.violinplot(x ='day', y ='tip',
                   data = tip,
                   inner="points")
Python3
# Python program to illustrate
# violinplot using inbuilt data-set
# given in seaborn

# importing the required module
import seaborn

# use to set style of background of plot
seaborn.set(style = 'whitegrid')

# loading data-set
tip = seaborn.load_dataset('tips')
plt.figure(figsize=(4,7))

seaborn.violinplot(x ='day', y ='tip',
                   data = tip,
                   inner="stick")
Python3
# Python program to illustrate
# violinplot using inbuilt data-set
# given in seaborn

# importing the required module
import seaborn

# use to set style of background of plot
seaborn.set(style = 'whitegrid')

# loading data-set
tip = seaborn.load_dataset('tips')
plt.figure(figsize=(4,7))

seaborn.violinplot(x ='day', y ='tip',
                   data = tip,
                   inner="quartile")
Python3
# Python program to illustrate
# violinplot using inbuilt data-set
# given in seaborn

# importing the required module
import seaborn

# use to set style of background of plot
seaborn.set(style = 'whitegrid')

# loading data-set
tip = seaborn.load_dataset('tips')
plt.figure(figsize=(4,7))

seaborn.violinplot(x ='day', y ='tip', data = tip)
seaborn.swarmplot(x ='day', y ='tip', data = tip,color= "white")
输出:

示例 2:
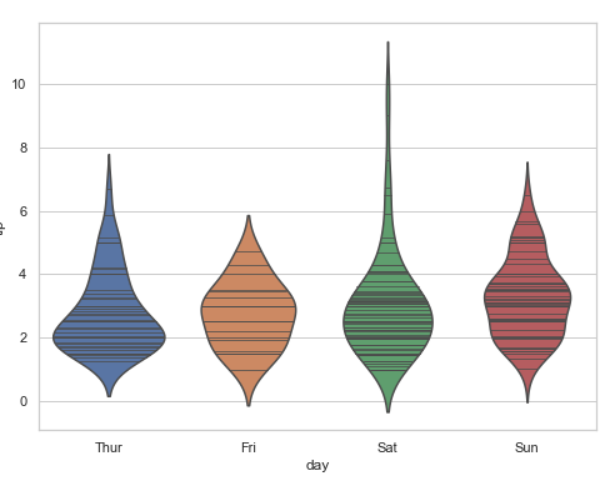
我们看到上面的实现,让我们对“棍子”做同样的事情。此选项将数据显示为小提琴图上的线条。
蟒蛇3
# Python program to illustrate
# violinplot using inbuilt data-set
# given in seaborn

# importing the required module
import seaborn

# use to set style of background of plot
seaborn.set(style = 'whitegrid')

# loading data-set
tip = seaborn.load_dataset('tips')
plt.figure(figsize=(4,7))

seaborn.violinplot(x ='day', y ='tip',
                   data = tip,
                   inner="stick")
输出:
示例 3:
使用四分位数绘制分布的四分位数。
蟒蛇3
# Python program to illustrate
# violinplot using inbuilt data-set
# given in seaborn

# importing the required module
import seaborn

# use to set style of background of plot
seaborn.set(style = 'whitegrid')

# loading data-set
tip = seaborn.load_dataset('tips')
plt.figure(figsize=(4,7))

seaborn.violinplot(x ='day', y ='tip',
                   data = tip,
                   inner="quartile")
输出:

方法 2#:使用 swarmplot()。
使用 swarampplot 我们可以在小提琴图中显示内部的数据点。
蟒蛇3
# Python program to illustrate
# violinplot using inbuilt data-set
# given in seaborn

# importing the required module
import seaborn

# use to set style of background of plot
seaborn.set(style = 'whitegrid')

# loading data-set
tip = seaborn.load_dataset('tips')
plt.figure(figsize=(4,7))

seaborn.violinplot(x ='day', y ='tip', data = tip)
seaborn.swarmplot(x ='day', y ='tip', data = tip,color= "white")
输出:
