散景 – 地块的网格布局
Bokeh 包括多个用于排列绘图和小部件的布局选项。它们使排列多个组件以创建交互式仪表板或数据应用程序成为可能。布局函数可让您构建图表和小部件的网格。您可以根据需要将任意多的行、列或网格嵌套在一起。此外,散景布局支持多种“大小调整模式”。这些大小调整模式允许绘图和小部件根据浏览器窗口调整大小。
网格布局 :
网格布局基本上意味着你所有的图都将采用基于网格的格式,那些使用过一些基本 css 的人,bootstrap 可以很容易地理解网格代表什么。
如何安装散景:
pip install bokeh所有示例的基本方法:
- 首先计算List1,List2,List3 这三个是对currentList 进行一些操作得到的列表,它们三个的长度相同,List1 与currentList 的相同(List1=currentList)。
- List2 和 List3 将是对 currentList 执行的不同操作,并且在每个示例中,操作都会不同。
- 最后在计算 List2、List3 后,我们将使用 Bokeh-grid Layout 绘制其中三个 List1、List2、List3。
- Grid Layout 基本上就是我们将(currentList, List1),(currentList, List1), (currentList, List1) 以网格的形式来表示,懂bootstrap和css的人很容易联想到这里grid的含义。
示例 1:
- 在这里,我们将给出从 0 到 6 的 currentList 值,这就是我们使用 range(7) 的原因,然后我们将其传递给 list() 构造函数,然后将其分配给 List1。
- 现在 List2 将表示 currentList 中每个元素的平方根List2=[i**0.5 for i in currentList]而 List3 将表示 currentList List3=[i**2 for i in currentList]中每个元素的平方,我们知道在Python,我们可以使用 **运算符轻松执行幂运算符,因为我们使用 **0.5 计算平方根和 **2 计算平方。
- 对于 (currentList, List1) 图,我们将使用圆圈表示图上的点,对于 (currentList, List2) 三角形和 (currentList, List3) 正方形。并且输出将在代码中提到的 GFG.html 中生成。
- background_fill_color 中的 f1 = figure(background_fill_color=”#27292e”)表示您也可以自定义的背景颜色。
- f1.triangle(currentList, y0, size=9, alpha=0.5, color=”#de040f”)这里 size =9 表示图上点的大小,color 表示点的颜色,alpha 表示暗或亮的程度你想要,你也可以尝试改变这些属性来更好地理解。
- 现在显示网格布局中的所有绘图show( gridplot([[f1, f2], [f3, None]], plot_width=200, plot_height=200))。
句法 :
output_file("GFG.html")
currentList = list(range(7))

# writing logics for List1,List2,List2
# creating plots with these attributes
# color,backgroundcolor,aplha ,size
# splots are f1,f2,f3
# using grid layout
show(gridplot([[f1, f2], [f3, None]], plot_width=200, plot_height=200))
下面是实现:
Python3
# python program for bokeh grid layout
from bokeh.io import output_file, show
from bokeh.layouts import gridplot
from bokeh.plotting import figure

# output will be produced in GFG.html
output_file("GFG.html")

# list will contain from 0 to 6
currentList = list(range(7))

# y0 is equals to x no change
List1 = currentList

# y1 square root of x
List2 = [i**0.5 for i in currentList]

# y2 square  of x
List3 = [i**2 for i in currentList]

# now creating plots f1,f2,f3
f1 = figure(background_fill_color="#27292e")
f1.triangle(currentList, List1, size=9, alpha=0.5, color="#de040f")

f2 = figure(background_fill_color="#27292e")
f2.circle(currentList, List2, size=9, alpha=0.5, color="#0828a8")

f3 = figure(background_fill_color="#27292e")
f3.square(currentList, List3, size=9, alpha=0.5, color="#b3810c")

# using grid layout on f1,f2,f3 plots
show(gridplot([[f1, f2], [f3, None]], plot_width=200, plot_height=200))
Python3
# python program for bokeh grid layout
from bokeh.io import output_file, show
from bokeh.layouts import gridplot
from bokeh.plotting import figure

# output will be produced in GFG.html
output_file("GFG.html")

# list will contain from 0 to 6
currentList = list(range(7))

# List1 is equals to currentList no change
List1 = currentList

# List2 square root of currentList
List2 = [abs(20-i) for i in currentList]

# List3 square  of currentList
List3 = [abs(i-i**0.5) for i in currentList]

# now creating plots f1,f2,f3
f1 = figure(background_fill_color="#27292e")
f1.triangle(currentList, List1, size=9, alpha=0.5, color="#de040f")

f2 = figure(background_fill_color="#27292e")
f2.circle(currentList, List2, size=9, alpha=0.5, color="#0828a8")

f3 = figure(background_fill_color="#27292e")
f3.square(currentList, List3, size=9, alpha=0.5, color="#b3810c")

# using grid layout on f1,f2,f3 plots

show(gridplot([[f1, f2], [f3, None]], plot_width=200, plot_height=200))
输出 :

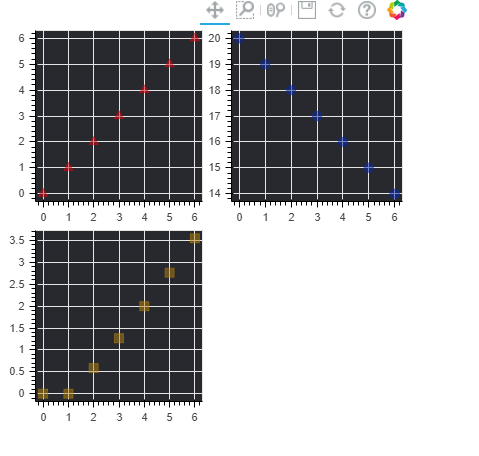
示例 2:
- 请注意,在此示例中,我们仅更改了计算 List2、List3 的逻辑,其他内容相同。
- 在这里,我们将给出从 0 到 6 的 currentList 值,这就是为什么我们使用 range(7) 然后我们在 list() 构造函数中传递它,然后我们将它分配给 List1。
- 现在让我们计算 List2,List3 这里 List2 将代表 20 和 currentList 的每个元素之间的绝对差List2=[abs(20-i) for i in currentList]和 List3 代表 currentList 的每个元素和该元素的平方根之间的绝对差List3=[abs(ii**0.5) for i in currentList]。
- 为什么我们使用 abs()函数,因为在某些情况下,我们使用 abs() 可能会得到一个负值将其转换为正值。
- 现在我们将再次在三个图 (currentList,List1)、(currentList,List2) 和 (currentList,List3) 上使用网格。
- 在这里,我们使用圆圈代表第一个图上的一个点,第二个图上的三角形代表第三个我们使用正方形。
- 输出将显示在代码中编写的 GFG.html 上。
- background_fill_color 中的 f1 = figure(background_fill_color=”#27292e”)表示您也可以自定义的背景颜色。
- f1.triangle(currentList, y0, size=9, alpha=0.5, color=”#de040f”)这里 size =9 表示图上点的大小,color 表示点的颜色,alpha 表示暗或亮的程度你想要,你也可以尝试改变这些属性来更好地理解。
- 现在显示网格布局中的所有绘图show( gridplot([[f1, f2], [f3, None]], plot_width=200, plot_height=200))。
句法 :
output_file("GFG.html")
currentList = list(range(7))

# writing logics for List1,List2,List3
# creating plots with these attributes
# color,backgroundcolor,aplha,size
# plots are f1,f2,f3
# using grid layout
show( gridplot([[f1, f2], [f3, None]], plot_width=200, plot_height=200))
下面是实现:
蟒蛇3
# python program for bokeh grid layout
from bokeh.io import output_file, show
from bokeh.layouts import gridplot
from bokeh.plotting import figure

# output will be produced in GFG.html
output_file("GFG.html")

# list will contain from 0 to 6
currentList = list(range(7))

# List1 is equals to currentList no change
List1 = currentList

# List2 square root of currentList
List2 = [abs(20-i) for i in currentList]

# List3 square  of currentList
List3 = [abs(i-i**0.5) for i in currentList]

# now creating plots f1,f2,f3
f1 = figure(background_fill_color="#27292e")
f1.triangle(currentList, List1, size=9, alpha=0.5, color="#de040f")

f2 = figure(background_fill_color="#27292e")
f2.circle(currentList, List2, size=9, alpha=0.5, color="#0828a8")

f3 = figure(background_fill_color="#27292e")
f3.square(currentList, List3, size=9, alpha=0.5, color="#b3810c")

# using grid layout on f1,f2,f3 plots

show(gridplot([[f1, f2], [f3, None]], plot_width=200, plot_height=200))
输出 :