使用 Dplyr 过滤或子集 R 中的行
在本文中,我们将使用 Dplyr 包从 R 编程语言中的数据帧中过滤行。
使用中的数据框:
方法 1:使用 filter() 对行进行子集或过滤
要过滤或子集行,我们将使用 filter()函数。
语法:
filter(dataframe,condition)
这里,dataframe是输入的dataframe,condition用于过滤dataframe中的数据
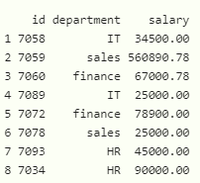
示例:过滤数据框的R程序
R
# load the package
library(dplyr)
# create the dataframe with three columns
# id , department and salary with 8 rows
data=data.frame(id=c(7058,7059,7060,7089,7072,7078,7093,7034),
department=c('IT','sales','finance','IT','finance',
'sales','HR','HR'),
salary=c(34500.00,560890.78,67000.78,25000.00,
78900.00,25000.00,45000.00,90000))
#display actual dataframe
print(data)
print("==========================")
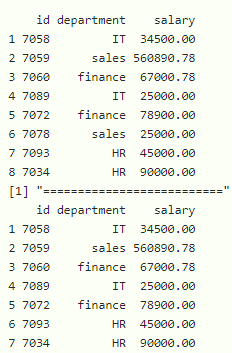
#filter dataframe with department is sales
print(filter(data,department=="sales"))R
# load the package
library(dplyr)

# create the dataframe with three columns
# id , department and salary with 8 rows
data=data.frame(id=c(7058,7059,7060,7089,7072,7078,7093,7034),

                department=c('IT','sales','finance','IT','finance',
                             'sales','HR','HR'),

                salary=c(34500.00,560890.78,67000.78,25000.00,
                         78900.00,25000.00,45000.00,90000))

# display actual  dataframe
print(data)
print("==========================")

# filter dataframe with department is sales and
# salary is greater than 27000
print(filter(data,department=="sales" & salary >27000))
R
# load the package
library(dplyr)

# create the dataframe with three columns
# id , department and salary with 8 rows
data=data.frame(id=c(7058,7059,7060,7089,7072,7078,7093,7034),

                department=c('IT','sales','finance','IT','finance',
                             'sales','HR','HR'),

                salary=c(34500.00,560890.78,67000.78,25000.00,
                         78900.00,25000.00,45000.00,90000))

# display actual  dataframe
print(data)
print("==========================")

# filter dataframe with department is IT or salary
# is greater than 27000
print(filter(data,department=="IT" |  salary >27000))
R
# load the package
library(dplyr)

# create the dataframe with three columns
# id , department and salary with 8 rows
data=data.frame(id=c(7058,7059,7060,7089,7072,7078,7093,7034),

                department=c('IT','sales','finance','IT','finance',
                             'sales','HR','HR'),

                salary=c(34500.00,560890.78,67000.78,25000.00,
                         78900.00,25000.00,45000.00,90000))

# display actual  dataframe
print(data)
print("==========================")

# filter dataframe with department is sales
# and salary is greater than 27000 or salary
# less than 5000
print(filter(data,department=="sales" & salary >27000 | salary<5000))
R
# load the package
library(dplyr)

# create the dataframe with three columns
# id , department and salary with 8 rows
data=data.frame(id=c(7058,7059,7060,7089,7072,7078,7093,7034),

                department=c('IT','sales','finance','IT','finance',
                             'sales','HR','HR'),

                salary=c(34500.00,560890.78,67000.78,25000.00,
                         78900.00,25000.00,45000.00,90000))

# display actual  dataframe
print(data)
print("==========================")

# display top 3 values with slice_head
data %>% slice_head(n=3)
print("==========================")

# display top 5 values with slice_head
data %>% slice_head(n=5)
print("==========================")

# display top 1 value  with slice_head
data %>% slice_head(n=1)
R
# load the package
library(dplyr)

# create the dataframe with three columns
# id , department and salary with 8 rows
data=data.frame(id=c(7058,7059,7060,7089,7072,7078,7093,7034),

                department=c('IT','sales','finance','IT','finance',
                             'sales','HR','HR'),

                salary=c(34500.00,560890.78,67000.78,25000.00,
                         78900.00,25000.00,45000.00,90000))

# display actual  dataframe
print(data)
print("==========================")

# display last 3 values with slice_tail
data %>% slice_tail(n=3)
print("==========================")


# display last 5 values with slice_tail
data %>% slice_tail(n=5)
print("==========================")

# display last 1 value  with slice_tail
data %>% slice_tail(n=1)
R
# load the package
library(dplyr)

# create the dataframe with three columns
# id , department and salary with 8 rows
data=data.frame(id=c(7058,7059,7060,7089,7072,7078,7093,7034),

                department=c('IT','sales','finance','IT','finance',
                             'sales','HR','HR'),

                salary=c(34500.00,560890.78,67000.78,25000.00,78900.00,
                         25000.00,45000.00,90000))

# display actual  dataframe
print(data)
print("==========================")

# display last 3 values with top_n
data %>% top_n(n=3)
print("==========================")

# display last 5 values with top_n
data %>% top_n(n=5)
print("==========================")

# display last 1 value  with top_n
data %>% top_n(n=1)
R
# load the package
library(dplyr)

# create the dataframe with three columns
# id , department and salary with 8 rows
data=data.frame(id=c(7058,7059,7060,7089,7072,7078,7093,7034),

                department=c('IT','sales','finance','IT','finance',
                             'sales','HR','HR'),

                salary=c(34500.00,560890.78,67000.78,25000.00,
                         78900.00,25000.00,45000.00,90000))

# display actual  dataframe
print(data)
print("==========================")

# display last 3 values with slice_sample
data %>% slice_sample(n=3)
print("==========================")

# display last 5 values with slice_sample
data %>% slice_sample(n=5)
print("==========================")

# display last 1 value  with slice_sample
data %>% slice_sample(n=1)
R
# load the package
library(dplyr)

# create the dataframe with three columns
# id , department and salary with 8 rows
data=data.frame(id=c(7058,7059,7060,7089,7072,7078,7093,7034),

                department=c('IT','sales','finance','IT','finance',
                             'sales','HR','HR'),

                salary=c(34500.00,560890.78,67000.78,25000.00,
                         78900.00,25000.00,45000.00,90000))

# display actual  dataframe
print(data)
print("==========================")

# return top 3 maximum rows based on salary
# column in the dataframe
print(data %>% slice_max(salary, n = 3))
print("==========================")

# return top 5 maximum rows based on department
# column in the dataframe
print(data %>% slice_max(department, n = 5))
print("==========================")
R
# load the package
library(dplyr)

# create the dataframe with three columns
# id , department and salary with 8 rows
data=data.frame(id=c(7058,7059,7060,7089,7072,7078,7093,7034),

                department=c('IT','sales','finance','IT','finance',
                             'sales','HR','HR'),

                salary=c(34500.00,560890.78,67000.78,25000.00,
                         78900.00,25000.00,45000.00,90000))

# display actual  dataframe
print(data)
print("==========================")

# return top 3 minimum rows based on salary
# column in the dataframe
print(data %>% slice_min(salary, n = 3))
print("==========================")

# return top 5 minimum rows based on department
# column in the dataframe
print(data %>% slice_min(department, n = 5))
print("==========================")
R
# load the package
library(dplyr)

# create the dataframe with three columns
# id , department and salary with 8 rows
data=data.frame(id=c(7058,7059,7060,7089,7072,7078,7093,7034),

                department=c('IT','sales','finance','IT','finance',
                             'sales','HR','HR'),

                salary=c(34500.00,560890.78,67000.78,25000.00,
                         78900.00,25000.00,45000.00,90000))

# display actual  dataframe
print(data)
print("==========================")

# return 2 rows
print(sample_frac(data,0.2))
print("==========================")

# return 4 rows
print(sample_frac(data,0.4))
print("==========================")

# return 7 rows
print(sample_frac(data,0.7))
print("==========================")
输出:
方法 2:过滤具有多个条件的数据框
我们将使用 filter函数来过滤行。这里我们必须在过滤函数指定条件。
句法:
filter(dataframe,condition1condition2,.condition n)
这里,dataframe 是输入数据帧,条件用于过滤数据帧中的数据
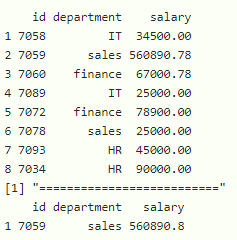
示例:过滤多行的 R 程序
电阻
# load the package
library(dplyr)
# create the dataframe with three columns
# id , department and salary with 8 rows
data=data.frame(id=c(7058,7059,7060,7089,7072,7078,7093,7034),
department=c('IT','sales','finance','IT','finance',
'sales','HR','HR'),
salary=c(34500.00,560890.78,67000.78,25000.00,
78900.00,25000.00,45000.00,90000))
# display actual dataframe
print(data)
print("==========================")
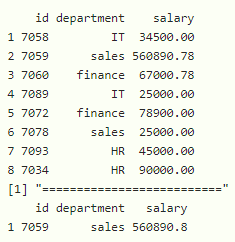
# filter dataframe with department is sales and
# salary is greater than 27000
print(filter(data,department=="sales" & salary >27000))
输出:
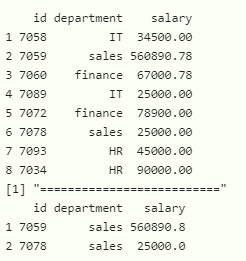
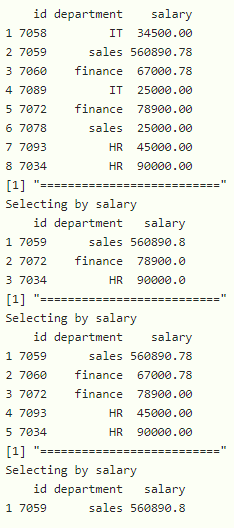
示例:按 OR运算符过滤行
电阻
# load the package
library(dplyr)

# create the dataframe with three columns
# id , department and salary with 8 rows
data=data.frame(id=c(7058,7059,7060,7089,7072,7078,7093,7034),

                department=c('IT','sales','finance','IT','finance',
                             'sales','HR','HR'),

                salary=c(34500.00,560890.78,67000.78,25000.00,
                         78900.00,25000.00,45000.00,90000))

# display actual  dataframe
print(data)
print("==========================")

# filter dataframe with department is IT or salary
# is greater than 27000
print(filter(data,department=="IT" |  salary >27000))
输出:
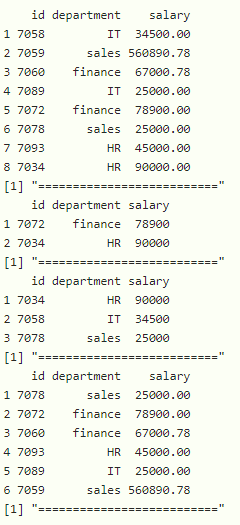
示例: R 程序使用和、或进行过滤
电阻
# load the package
library(dplyr)

# create the dataframe with three columns
# id , department and salary with 8 rows
data=data.frame(id=c(7058,7059,7060,7089,7072,7078,7093,7034),

                department=c('IT','sales','finance','IT','finance',
                             'sales','HR','HR'),

                salary=c(34500.00,560890.78,67000.78,25000.00,
                         78900.00,25000.00,45000.00,90000))

# display actual  dataframe
print(data)
print("==========================")

# filter dataframe with department is sales
# and salary is greater than 27000 or salary
# less than 5000
print(filter(data,department=="sales" & salary >27000 | salary<5000))
输出:
方法三:使用 slice_head()函数
此函数用于从数据框中获取前 n 行。
语法:
dataframe %>% slice_head(n)
其中,dataframe 是输入数据帧,%>% 是加载数据帧的运算符(管道运算符),n 是要显示的行数。
示例:使用 slice_head() 过滤行的 R 程序
电阻
# load the package
library(dplyr)
# create the dataframe with three columns
# id , department and salary with 8 rows
data=data.frame(id=c(7058,7059,7060,7089,7072,7078,7093,7034),
department=c('IT','sales','finance','IT','finance',
'sales','HR','HR'),
salary=c(34500.00,560890.78,67000.78,25000.00,
78900.00,25000.00,45000.00,90000))
# display actual dataframe
print(data)
print("==========================")
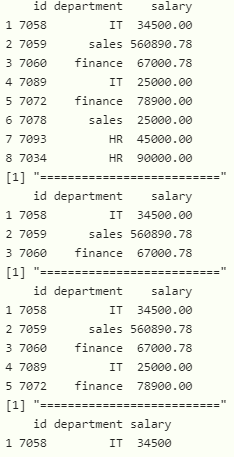
# display top 3 values with slice_head
data %>% slice_head(n=3)
print("==========================")
# display top 5 values with slice_head
data %>% slice_head(n=5)
print("==========================")
# display top 1 value with slice_head
data %>% slice_head(n=1)
输出:
方法四:使用 slice_tail()函数
此函数用于从数据框中获取最后 n 行
语法:
dataframe %>% slice_tail(n)
其中,dataframe 是输入数据帧,%>% 是加载数据帧的运算符(管道运算符),n 是从上次开始显示的行数
示例: R 程序使用 slice_tail() 方法过滤最后一行
电阻
# load the package
library(dplyr)

# create the dataframe with three columns
# id , department and salary with 8 rows
data=data.frame(id=c(7058,7059,7060,7089,7072,7078,7093,7034),

                department=c('IT','sales','finance','IT','finance',
                             'sales','HR','HR'),

                salary=c(34500.00,560890.78,67000.78,25000.00,
                         78900.00,25000.00,45000.00,90000))

# display actual  dataframe
print(data)
print("==========================")

# display last 3 values with slice_tail
data %>% slice_tail(n=3)
print("==========================")


# display last 5 values with slice_tail
data %>% slice_tail(n=5)
print("==========================")

# display last 1 value  with slice_tail
data %>% slice_tail(n=1)
输出:
方法五:使用top_n()函数
此函数用于获取前 n 行。
语法:
data %>% top_n(n=5)
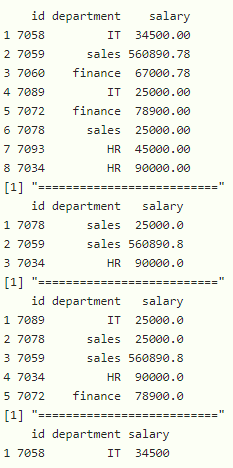
示例:使用 top_n()函数过滤行的 R 程序
电阻
# load the package
library(dplyr)

# create the dataframe with three columns
# id , department and salary with 8 rows
data=data.frame(id=c(7058,7059,7060,7089,7072,7078,7093,7034),

                department=c('IT','sales','finance','IT','finance',
                             'sales','HR','HR'),

                salary=c(34500.00,560890.78,67000.78,25000.00,78900.00,
                         25000.00,45000.00,90000))

# display actual  dataframe
print(data)
print("==========================")

# display last 3 values with top_n
data %>% top_n(n=3)
print("==========================")

# display last 5 values with top_n
data %>% top_n(n=5)
print("==========================")

# display last 1 value  with top_n
data %>% top_n(n=1)
输出:
方法六:使用 slice_sample()函数
在这里,我们将使用 slice_sample()函数过滤行,这将随机返回样本 n 行
语法:
slice_sample(n)
示例: R 程序使用 slice_sample()函数过滤行
电阻
# load the package
library(dplyr)

# create the dataframe with three columns
# id , department and salary with 8 rows
data=data.frame(id=c(7058,7059,7060,7089,7072,7078,7093,7034),

                department=c('IT','sales','finance','IT','finance',
                             'sales','HR','HR'),

                salary=c(34500.00,560890.78,67000.78,25000.00,
                         78900.00,25000.00,45000.00,90000))

# display actual  dataframe
print(data)
print("==========================")

# display last 3 values with slice_sample
data %>% slice_sample(n=3)
print("==========================")

# display last 5 values with slice_sample
data %>% slice_sample(n=5)
print("==========================")

# display last 1 value  with slice_sample
data %>% slice_sample(n=1)
输出:
方法七:使用 slice_max()函数
此函数基于列返回数据帧的最大 n 行
句法:
dataframe %>% slice_max(column, n )
其中数据帧是输入数据帧,列是数据帧列,其中基于此列返回最大行数,n 是要返回的最大行数
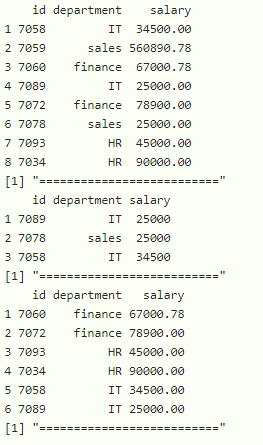
示例:使用 slice_max()函数过滤的 R 程序
电阻
# load the package
library(dplyr)

# create the dataframe with three columns
# id , department and salary with 8 rows
data=data.frame(id=c(7058,7059,7060,7089,7072,7078,7093,7034),

                department=c('IT','sales','finance','IT','finance',
                             'sales','HR','HR'),

                salary=c(34500.00,560890.78,67000.78,25000.00,
                         78900.00,25000.00,45000.00,90000))

# display actual  dataframe
print(data)
print("==========================")

# return top 3 maximum rows based on salary
# column in the dataframe
print(data %>% slice_max(salary, n = 3))
print("==========================")

# return top 5 maximum rows based on department
# column in the dataframe
print(data %>% slice_max(department, n = 5))
print("==========================")
输出:

方法八:使用 slice_min()函数
此函数基于列返回数据帧的最小 n 行
句法:
dataframe %>% slice_min(column, n )
其中数据帧是输入数据帧,列是数据帧列,其中基于此列返回最大行数,n 是要返回的最小行数
示例:使用 slice_min() 过滤的 R 程序
电阻
# load the package
library(dplyr)
# create the dataframe with three columns
# id , department and salary with 8 rows
data=data.frame(id=c(7058,7059,7060,7089,7072,7078,7093,7034),
department=c('IT','sales','finance','IT','finance',
'sales','HR','HR'),
salary=c(34500.00,560890.78,67000.78,25000.00,
78900.00,25000.00,45000.00,90000))
# display actual dataframe
print(data)
print("==========================")
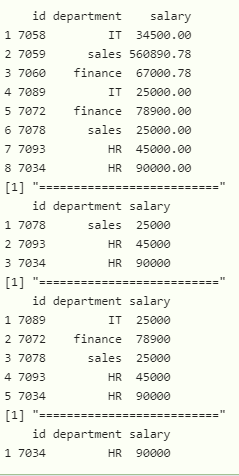
# return top 3 minimum rows based on salary
# column in the dataframe
print(data %>% slice_min(salary, n = 3))
print("==========================")
# return top 5 minimum rows based on department
# column in the dataframe
print(data %>% slice_min(department, n = 5))
print("==========================")
输出:
方法 9:使用 sample_frac()函数
sample_frac()函数从数据框(或表)中随机选择 n 个百分比的行。第一个参数包含数据框名称,第二个参数告诉要选择的行的百分比
句法:
(sample_frac(dataframe,n)
其中 dataframe 是输入数据帧,n 是分数值
示例:使用 sample_frac()函数过滤数据的 R 程序
电阻
# load the package
library(dplyr)

# create the dataframe with three columns
# id , department and salary with 8 rows
data=data.frame(id=c(7058,7059,7060,7089,7072,7078,7093,7034),

                department=c('IT','sales','finance','IT','finance',
                             'sales','HR','HR'),

                salary=c(34500.00,560890.78,67000.78,25000.00,
                         78900.00,25000.00,45000.00,90000))

# display actual  dataframe
print(data)
print("==========================")

# return 2 rows
print(sample_frac(data,0.2))
print("==========================")

# return 4 rows
print(sample_frac(data,0.4))
print("==========================")

# return 7 rows
print(sample_frac(data,0.7))
print("==========================")
输出: